Replaying Neural Signals using a Headphone Jack
There are a few standalone neural signal generators out there to test neural recording equipment—from Blackrock’s Signal Simulator to an unlisted one for Tucker Davis Technology headstages, both of which I have personally used. These are good for simple tests, simply to see that your gear is indeed recording correctly (i.e. assessing voltage and frequency). More complex generator designs leverage an FPGA, while the simplest solution is a cheap, handheld sine wave generator (this one even has an ECG waveform).
However, whether it be for a stimulation experiment, or to test neural detection equipment, replaying real and specific neural data may be important. In my case, I want to test the ability of some electronics to detect slow-wave neural activity (~0.5–4 Hz). My main concern is that a sine wave will never capture the nature of neural activity, and therefore, my goal is to use real neural data in a signal generator, but how?
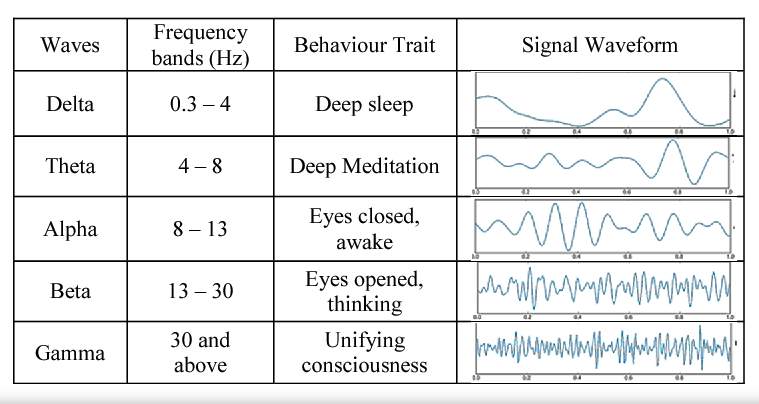
Common EEG bands: slow-wave activity overlaps with the Delta band, but is sometimes appreciated as its slowest components. Source: Analysis on Non-Linear Features of Electroencephalogram (EEG) Signal for Neuromarketing Application.
Any device with a headphone jack has a relatively nice digital-to-analog (DAC) converter inside, which is the core component behind generating accurate, biphasic signals with an amplitude that can easily be matched to those typical of neural electrode or EEG recordings. It also happens to be the case that audio files have a similar, if not higher sampling rate than neural data, at 44,100 Hz. Does this mean that neural data can be replayed through a headphone jack? Kind of, and it depends on the specific type of neural signal you are looking to replay.
Replaying high-frequency neural signals
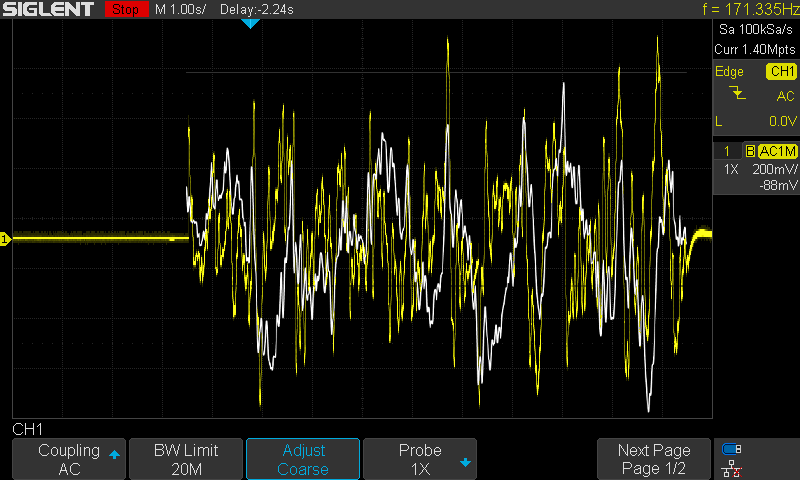
Replaying neural spiking (i.e. action potentials) is not a problem since their content (500–5,000 Hz) sits really well inside the audio band typical for human devices. For example, below is some real neural data that has been high-pass filtered in that band and then saved to an audio file.
Data from MATLAB (top) saved in an audio file and played through the headphone jack into an oscilloscope (bottom). A sine wave was added to the signal as a reference (as seen on the left).
This was achieved by simply first filtering the raw neural data (500-5,000 Hz), then interpolating the neural signal so that its original sampling rate (24,414 Hz) became the sampling rate of an MP4 (44,100), normalizing the signal to a scale of ±1, and then adding a reference sine wave to the beginning. I used the audiowrite() function in MATLAB and played the file through QuickTime.
What about low frequencies?
Since my questions center around slow-waves, I evaluated the accuracey and fidelity of replaying slow-wave data recorded from the Dreem EEG Headband, made available by Challenge Data. One of the identified slow waves is shown below.
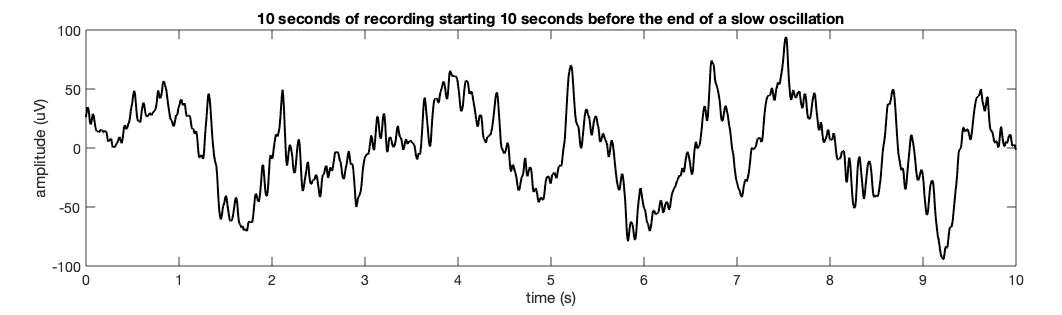
10s of slow-wave neural activity recorded by the Dreem EEG headband.
Again, the amplitude was normalized to ±1 and the data was interpolated (from 125 Hz) to make it consistent with the 44,100 Hz MP4 audio sampling rate. Below is an overlay of the waveform scaled to the resulting oscilloscope trace (using Photoshop). The results are not good.
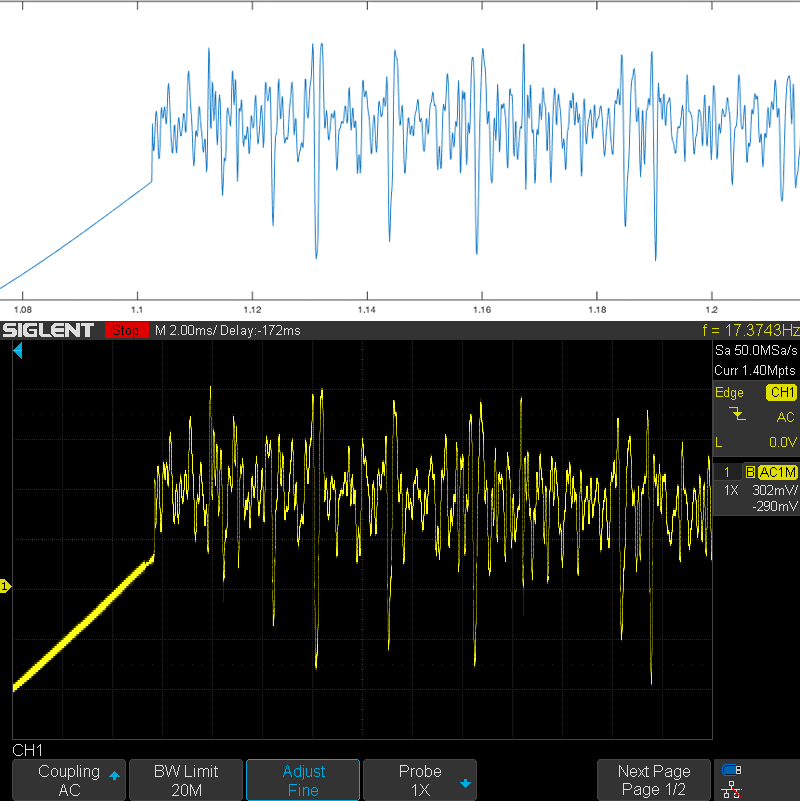
Slow-wave neural EEG from headphone jack (yellow) with the original signal overlaid from MATLAB (white).
Short of a few features, the signal has become severely distorted. Why? This could be for a few reasons, but the quick answer is that the headphone jack just doesn’t do well with low frequencies; in essence, there is a high pass filter at its end, which removes very-low-frequency content. Why? A speaker is meant to be driven using a biphasic voltage, which drives its coil back and forth, creating sound pressure waves. The human hearing range is roughly 20-20,000 Hz, meaning that except for very special applications, speakers should be moving, at a minimum, 20 times per second. Much slower than that and the speaker or amplifying circuitry can be damaged, thus, low frequencies are filtered out. This filter also takes care of any direct current (DC) biasing, which may also affect audio devices and quality. These specifications are pretty typical for a MacBook Pro:
Jack type: 3.5 mm stereo Maximum output voltage: 2 VRMS (+8.24 dBu) Output impedance: < 24 Ω Frequency response: 20 Hz to 20 kHz, +0.5 dB/-3 dB Signal-to-noise ratio (SNR): > 90 dB Total harmonic distortion + noise (THD+N): < -80 dB (0.01%) Channel separation: > 75 dB
Nail Into Coffin
Firstly, these results should be confirmed. Secondly, it begs the question, how low can a headphone go? To investigate this question, I create a sine wave of increasing frequency. Below is the actual signal I will use (black) plotted with a 0.5 Hz waveform (orange) as a visual reference.
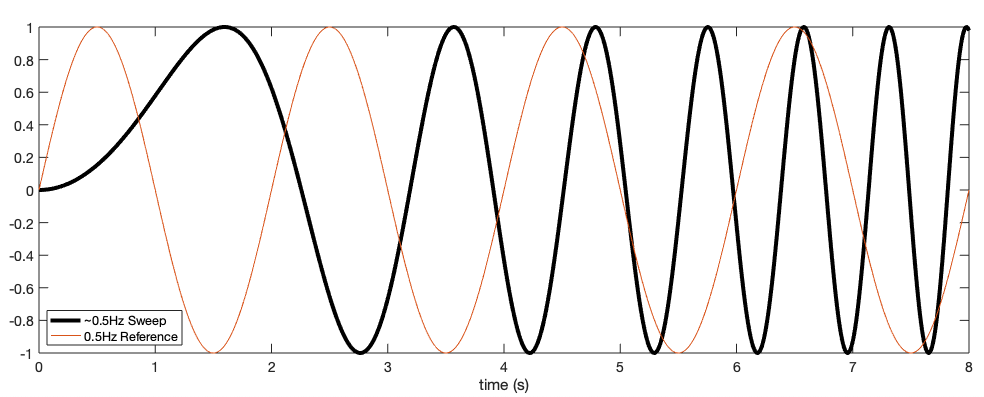
Waveform of increasing frequency (black) with a 0.5 Hz reference signal (orange).
Once again, the results below have the true signal overlaid in white. Notice how the low-frequency content at the beginning clips.
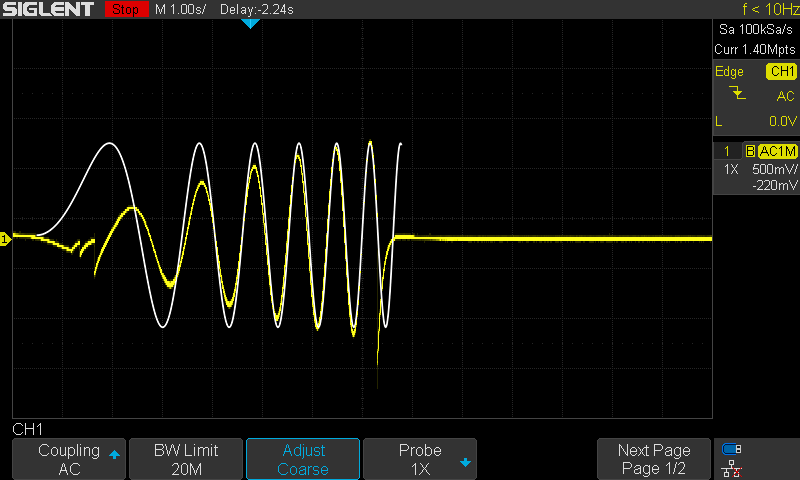
Signal of increasing frequency on oscilloscope (yellow) compared to the true signal (white).
What was very confusing throughout this study was that only some signals seemed to be affected, and it wasn’t always in a consistent manner. So I tried this: I played the signal backward, from high-frequency to low-frequency, and the signal remained relatively true.
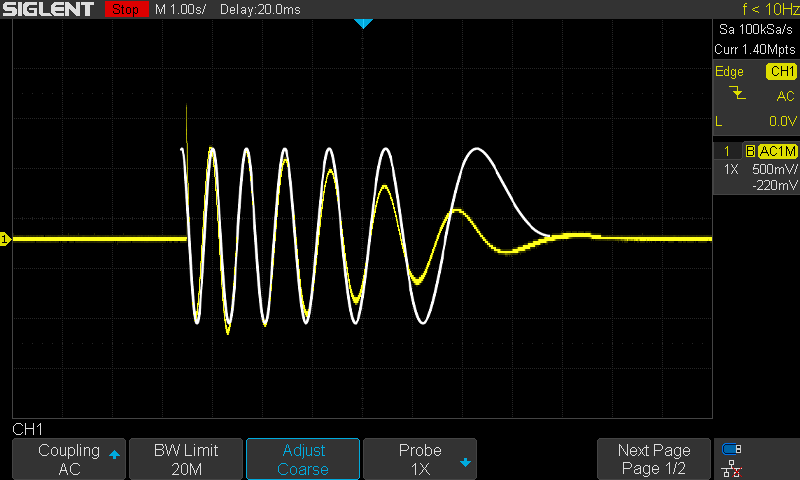
Signal of decreasing frequency on oscilloscope (yellow) compared to the true signal (white).
My instinct tells me that some simple charge-discharge dynamics occurring at the headphone jack is causing the observed hysteresis effect, which is beyond the scope of this article. My takeaway is that headphone jacks might work for some applications, but not where low frequencies are involved. For slow-wave activity, I would prefer a solution where I am not blinded as to what kind of filters are affecting my signal. This could be done by using a standalone DAC attached to a microcontroller that has access to the waveform. Audio files could still be used, but since they have a standard sampling rate much higher than what is required for neural data, it might be added complexity.
Notes
-
My laptop’s headphone jack will produce signals 1-volt peak-to-peak from an MP4 using files exported from MATLAB. I found that some YouTube clips of audio tones could achieve a higher amplitude. Just be careful, and remember, these data/tones could damage your speakers.
-
Line noise can be a major contaminate. I would highly recommend using a low-pass hardware filter at the end of the audio line to filter very high frequencies.
-
If this method is useful, it is advised to use a buffer circuit (see TL071) to reduce the possibility that the audio-side of things does not become damaged.
-
I would not recommend replaying signals directly from a headphone jack into a brain. This idea is a proof of concept and should have some buffering/isolation hardware at its tail end.
