Simpler Subplots: Converting Grid Coordinates to Axes Position
When you’re working with a subplot matrix where each row is some new analysis, using the standard “position” or p input to MATLAB subplot is not intuitive. Rather, you want to specify your subplot by rows and columns. This tiny function, prc, does that conversion.
The function requires the number of columns in your figure (cols) and the two-element position of your desired subplot (rc) given as an array in the format, [row, col].
Supplemental
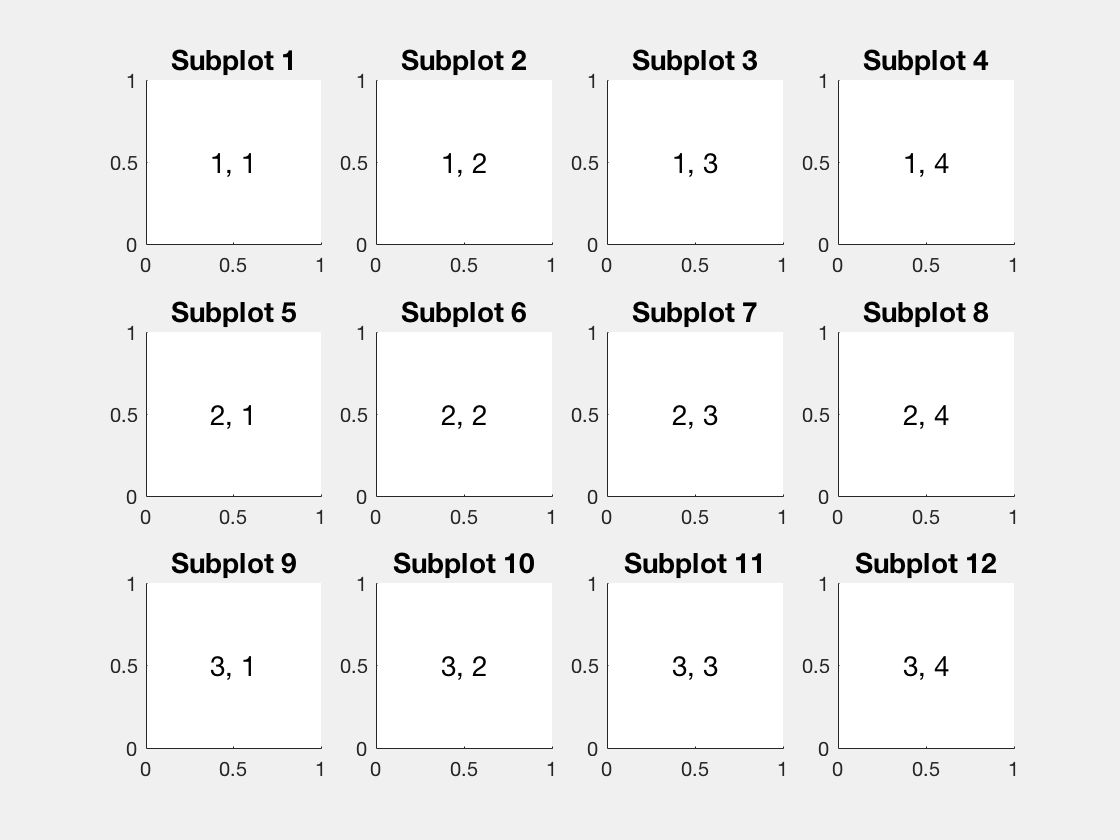
The figure above was generated with the following code.
