Extracting Spikes from Neural Electrophysiology in MATLAB
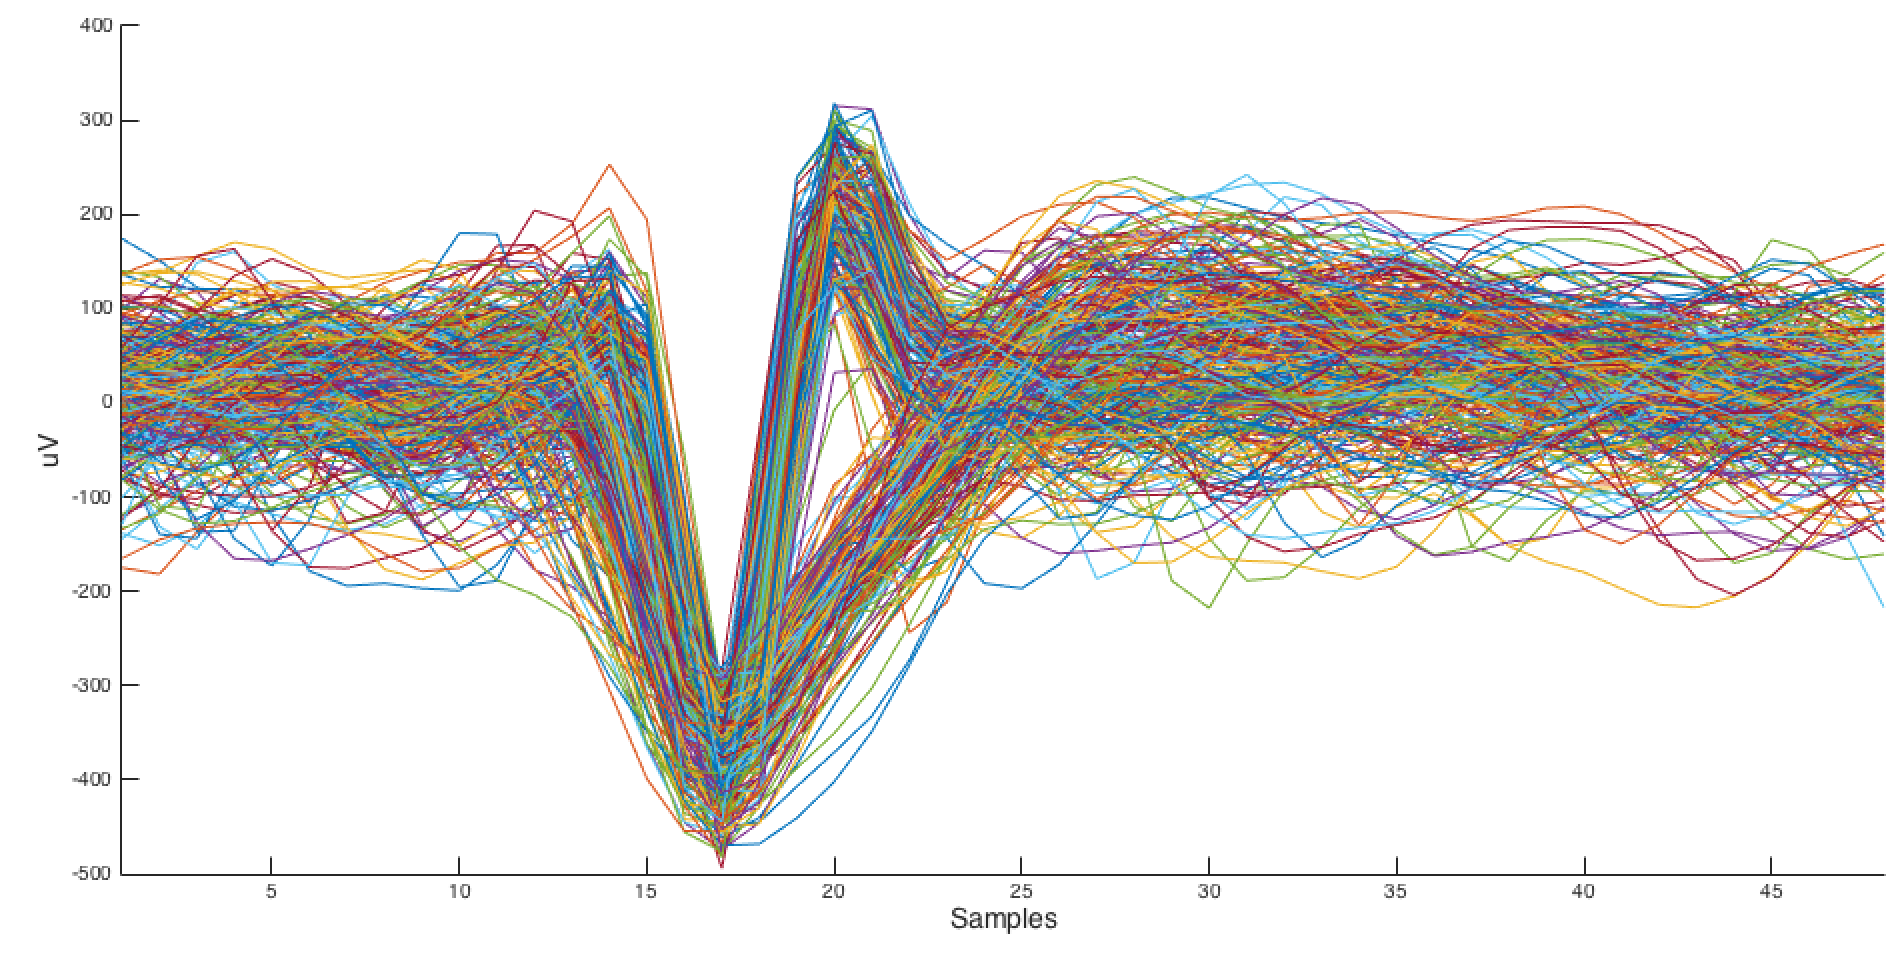
Neural spikes extracted using this method.
One hour of neural recordings amasses to nearly forty-three gigabytes of raw data for me. This is streamed through fiber optics onto our storage system and accounts for 128-channels, sampled at just over 24 kHz. If it was a good day, these files contain hundreds of thousands of spikes, so how to extract them?
Extracting spikes is just one step in our lab’s multi-step protocol to analyze animal behavior. With the flux of everyone from undergraduates to post-docs working with the code base, extracting spikes can’t be something only one person understands. This imposes a few constraints on the algorithm we implement—we want something that is reliable, but more importantly, simple.
The first step is the same no matter what extraction you use: we want to exclude the low frequency content of the signal. This will “flatten” the signal, and hopefully begin to highlight the high frequency neural spikes. I use a butterworth bandpass filter, with cutoff frequencies (Fc) between 244 Hz and 6.104 kHz. Depending on your sampling frequency (Fs), you can easily calculate your own Wn values (Wn = Fc/(Fs/2)).
>> [b,a] = butter(4, [0.02 0.5]);
>> filteredData = filtfilt(b,a,double(data));
At this point, you might think about removing high amplitude artifacts. Movement-related potentials will often soar above your spike amplitude, so everything above (and below) a certain level can be removed. It makes most sense to me to just apply a zero-amplitude segment in place of the artifact. You can find my code for artifactThresh.m, and here’s what it’s doing:
- Identify peaks above given threshold.
- Move forward and backward in time and identify when the signal reaches reasonable amplitude (when it “resets”).
- Replace the artifact spans with zeros.
Finally, it’s time to do the detection itself. What we really want to know is, at what times (or sample numbers) are there spikes? Bestel et al. reviewed some of the detection methods in use by others [1], they include:
- Hulata et al. (2002) Threshold; Wavelet reconstruction
- Wang et al. (2006) NEO + threshold
- Vargas-Irwin and Donoghue (2007) Threshold
- Fee et al. (1996) Threshold
- Wood et al. (2004) Threshold
- Sato et al. (2007) Peak–peak threshold
- Kim and Kim (2003) NEO + threshold
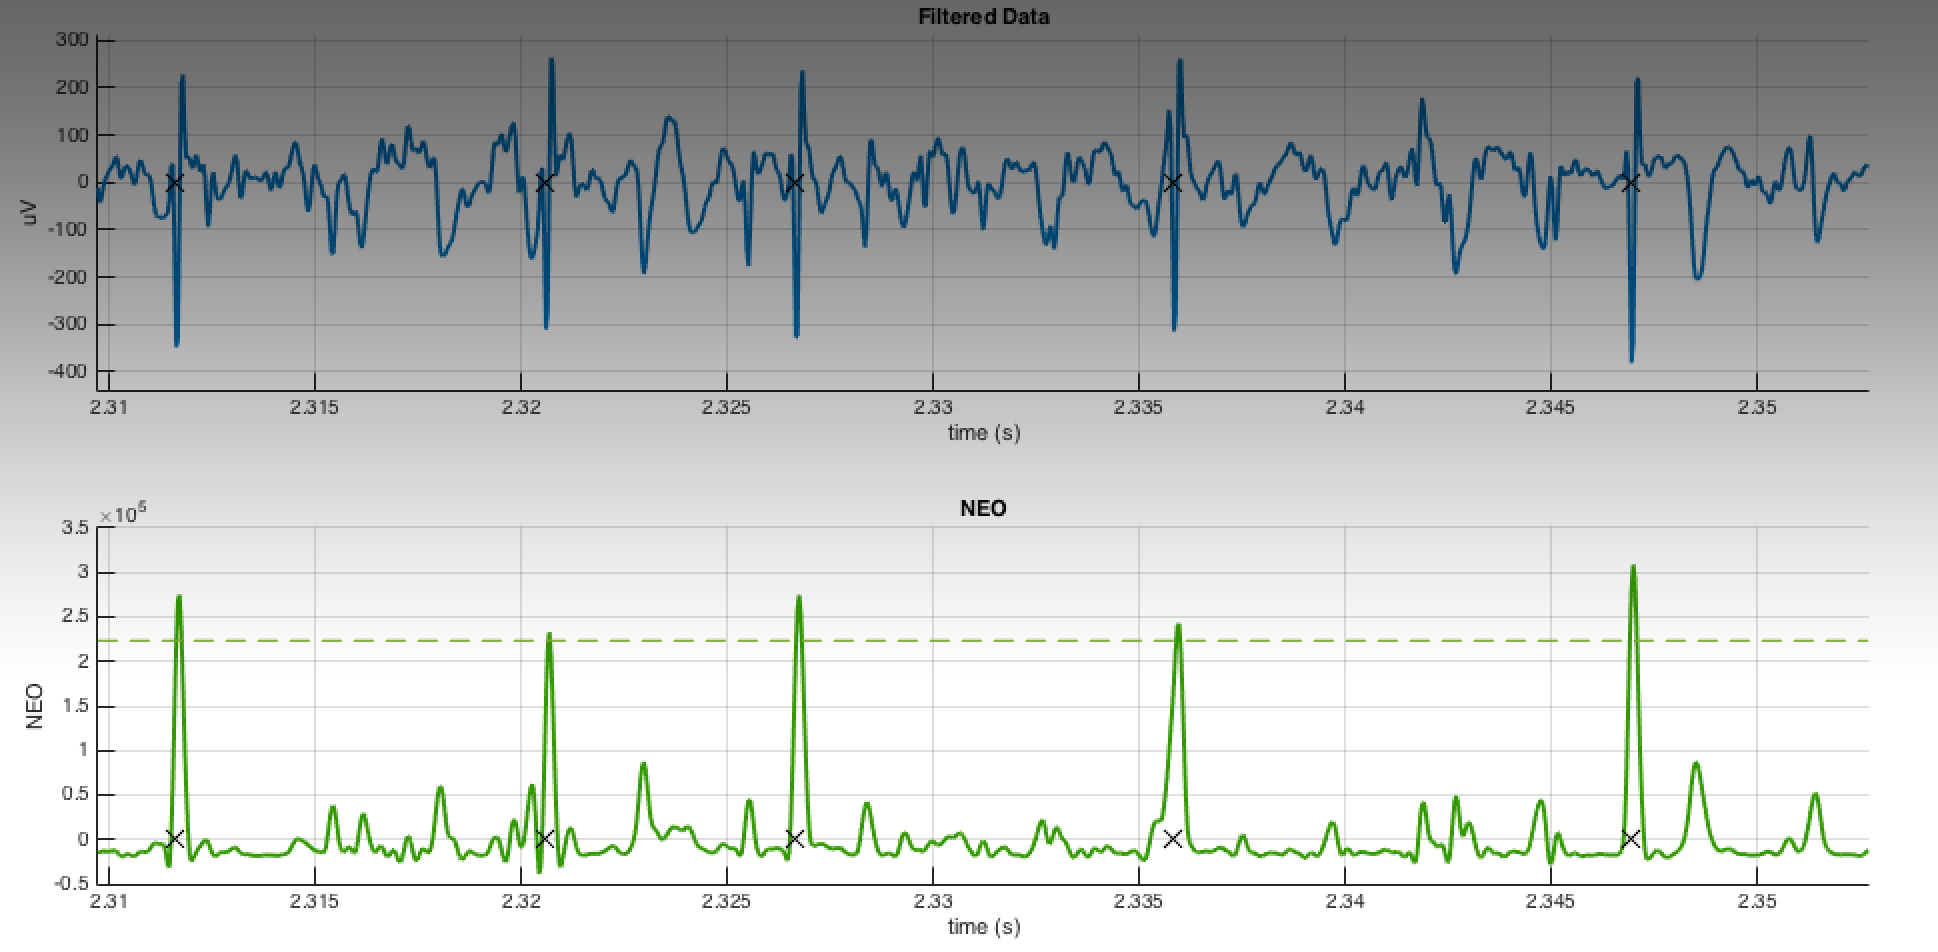
If you have a great signal to noise ratio, just drawing a threshold is by far the simplest method. You can even get pretty darn close just using peakseek.m by Peter O’Connor. Although we’ve done our best to eliminate any signal not within the “spiking” frequency band, unless your recordings are perfect you will still find that threshold method will catch a lot of noise. Being constrained to simple ideas, the Nonlinear Energy Operator (NEO) is the next obvious candidate, because as Sudipta & Ray show [2], you are basically squaring your signal but also subtracting the amplitude of neighboring samples. This ensures that the waveform is, indeed, spikey.

Where ψ is nonlinear energy, x is your data, and n is your sample number.
This serves to first, make big signals bigger, and small signals smaller (squaring), but also acts as a more selective high pass filter, as signals that are broad will have large amplitudes for neighboring samples. Now, you perform a threshold on the nonlinear energy value. Choosing a threshold is still a subjective process, although I have had success using a multiple of the median of nonlinear energy values. You can find all these operations in my function, getSpikeLocations.m (with two dependencies: peekseak.m and snle.m). The next step, which I don’t cover here, will be extracting the waveforms based on the timestamps and spike sorting them using either more MATLAB software, or a commercial product, like Plexon’s Offline Sorter.
1. Bestel, R., Daus, A. W. & Thielemann, C. A novel automated spike sorting algorithm with adaptable feature extraction. J. Neurosci. Methods 211, 168–78 (2012).
2. Mukhopadhyay, S. & Ray, G. C. A new interpretation of nonlinear energy operator and its efficacy in spike detection. IEEE Trans. Biomed. Eng. 45, 180–187 (1998).

amirali
November 12, 2021 at 3:59 pm
Dear Giadica,
My name is Amirali. I am working on the spike detection part. I see these methods. I will be a master of science. I love to have your code to work with and have a background file
Matt
November 12, 2021 at 4:01 pm
Amirali, feel free to contact me using the email button to explain your data and goals.