Threading a Narrative Using Knowledge Engineering
Threading a narrative is a problem of insight, intuition, style, and recall. Insight breeds novelty, intuition wayfinds, style breeds clarity and emotion, and recall ties words to reality. In terms of tactics, [I argue] the most important for an academic is recall—the narrative of a research synopsis or direction must be highly cited and supported and also leads an observer towards related ideas and literature. The problems with recall are many, namely, it is limited.
A solution to the infinite recall of your own knowledge history, and connecting that of other individuals, or across domains, or seeking data to challenge inherent biases, might just be solvable using knowledge engineering. In addition to answering whether these ideas are technically possible is whether they are feasible in current knowledge gathering and dissemination ecosystems and paradigms (e.g., publisher → PDF → human → MS word).
An Ontology Primer
Knowledge has been appreciated as a networked or “graph” phenomenon many years before Google launched their Knowledge Graph or it was first trademarked.
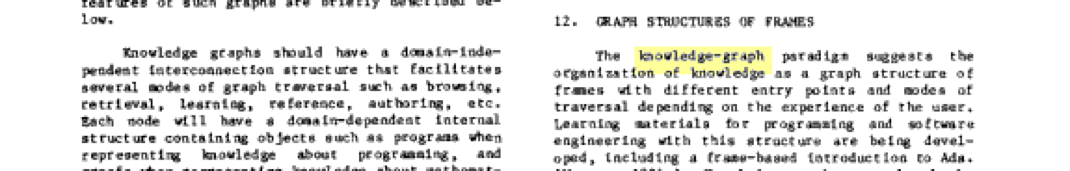
ITT Programming, 1983: “The knowledge-graph paradigm suggests the organization of knowledge as a graph structure of frames with different entry points and nodes of traversal depending on the experience of the user…”
Sharing knowledge, between humans but especially with computers, requires an ontology. That is, how is the information organized? which is hopefully shared but can be domain-specific. Gruber defines ontology as, a specification of a conceptualization. With an ontology, one can begin to identify how data is gathered, organized (an ontology), and synthesized.

Knowledge Graph Architecture, Lisa Ehrlinger and W. Woß (2016)
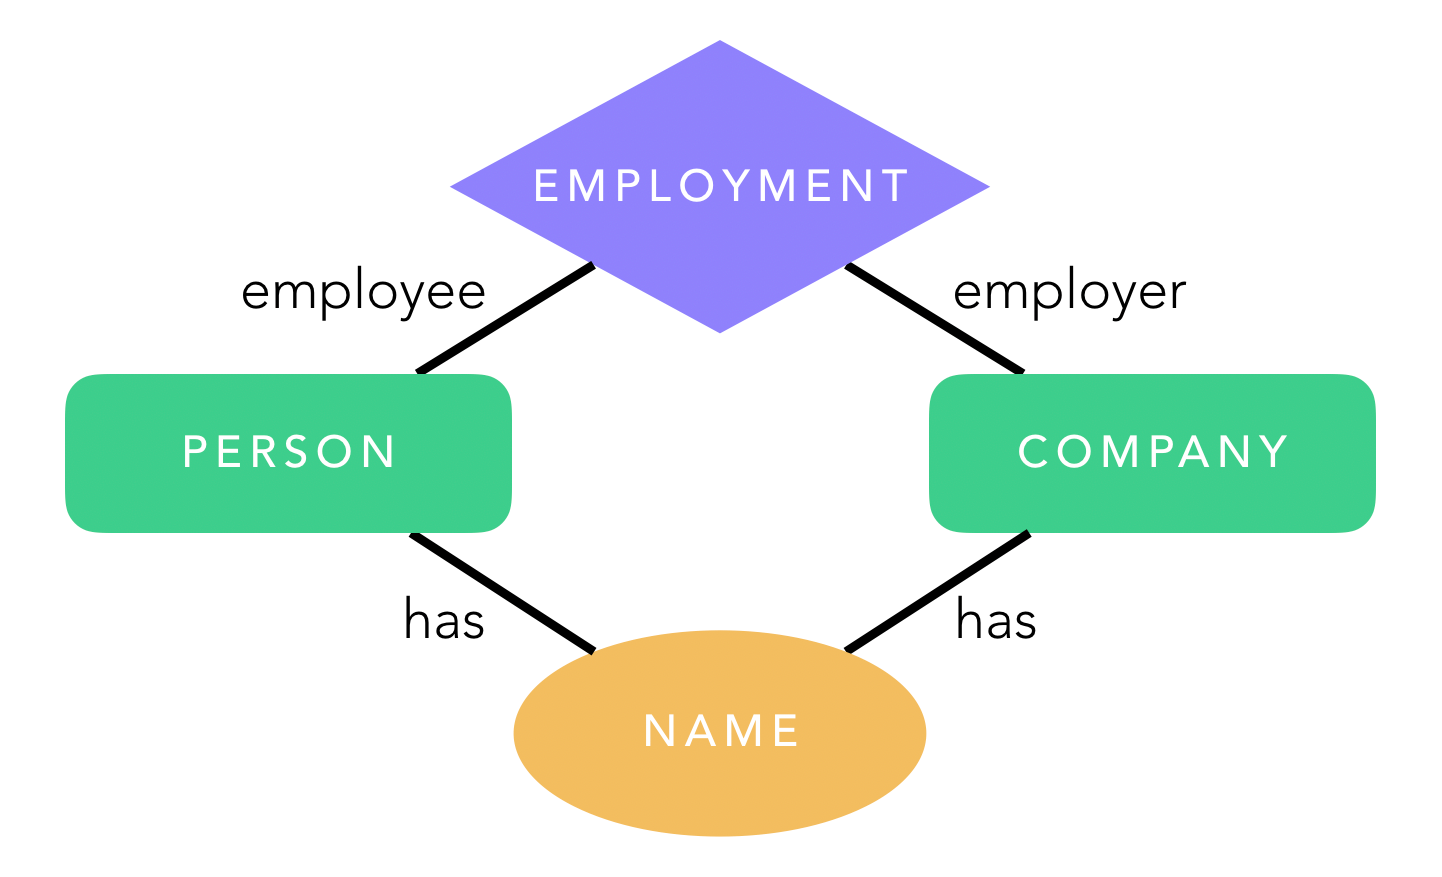
Ontologies can have several layers of abstraction which might be important for research applications. An ontology can be relatively low-level, built on the extraction of entities from text which can be put into the well-known semantic triple: subject, predicate, and object. For example, the statement, Dopamine is therapeutic to Parkinson’s disease, can be broken into the subject Parkinson’s disease, the object dopamine, and the predicate therapeutic. This structure may or may not inform (or be necessary to) the data model that underlies a “knowledge base,” but forms a basis for the entity-relationship of a domain.
The ontology and of an organization.
Operationalizing an Ontology
Grakn is an expressive knowledge graph that stores data based on the ontology (i.e. entity relationships or data model). From an organizational perspective, this maintains consistency with how data is often conceptualized—as a network of nodes (things) connected by edges (descriptors). Technologically, a graph database is optimized to answer questions regarding the traversal of knowledge. For example, a graph can easily find friends-of-friends, but may not be optimal for storing time-series data, like a sensor data stream.
Stori: towards a knowledge tool
Many projects in the life sciences—particularly biomedical science—are particularly well-suited for a graph knowledge base because the data is inherently ontological (person has disease, disease has genes, genes have inheretence). However, personal knowledge that builds towards a scientific narrative is less structured, which could be anecdotes or highlights from personal communication, papers, or books. The problem of individual knowledge synthesis can benefit from a similar framework but has constraints on the methods of gathering and synthesizing data.
Gathering data
There is no way around the unfortunate fact that consuming research will never be standardized. From distribution (e.g., publishers and paywalls) to reading methods (e.g., paper and electronic) to how interests are identified and saved (e.g., highlighting and audio notes). Because consumption is tied with creating structured input data, the best way forward is to identify the most common node. [My position] is that extracting annotations from PDFs is easy to adopt (if not already) and supports a robust pathway from natural consumption to structured data.
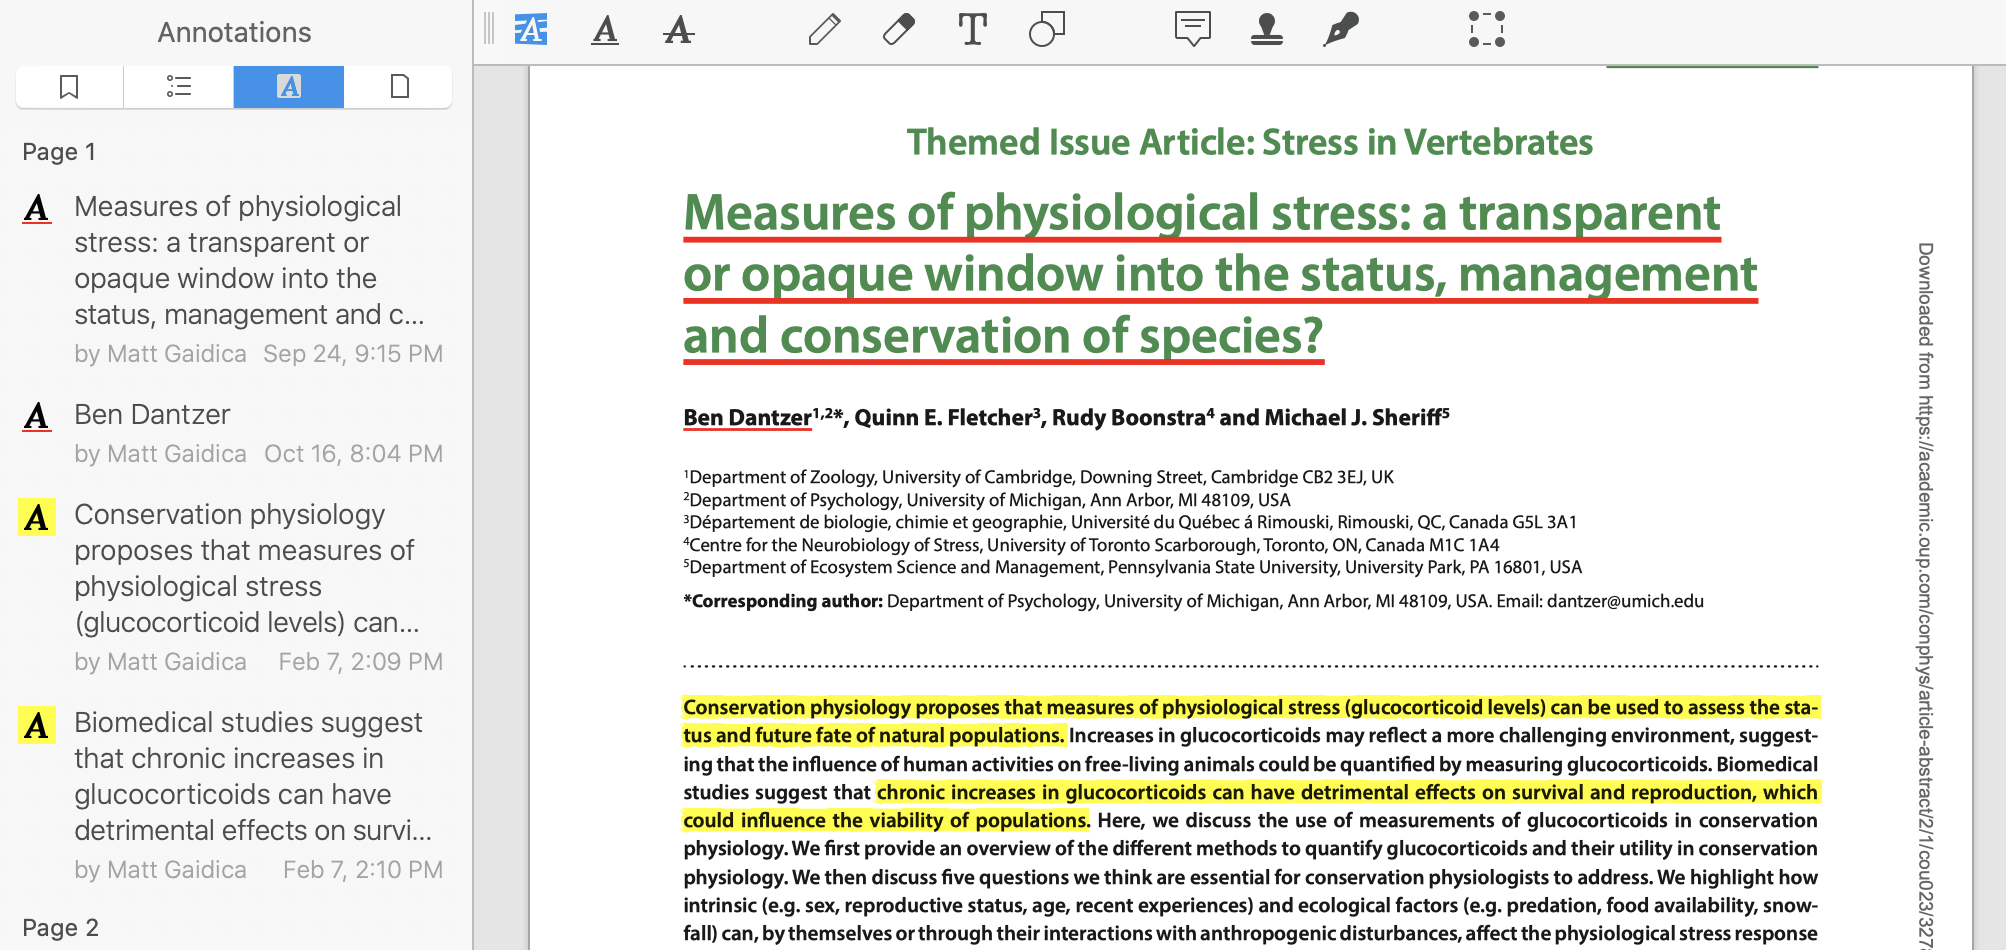
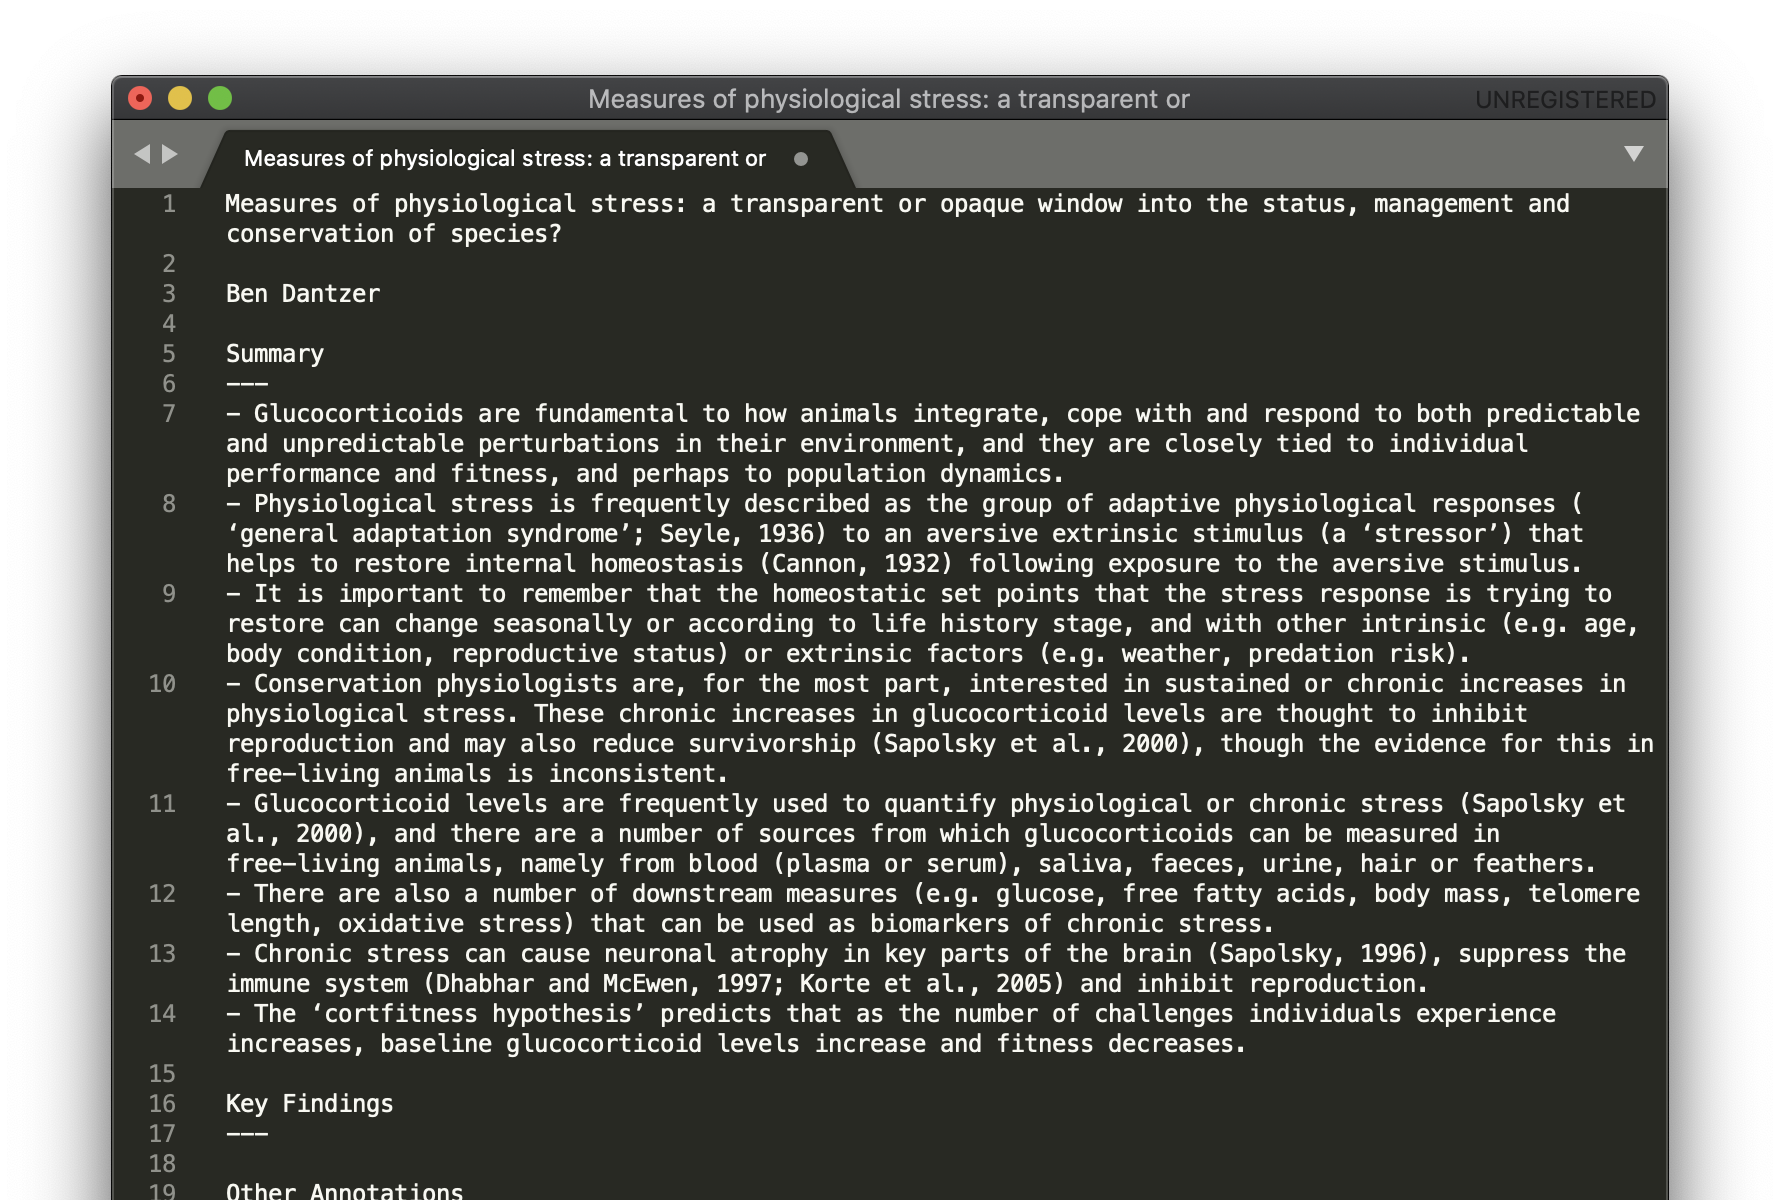
Easily extracting structured data (title, primary author, annotations) using PDF Expert.
Data from PDF annotations can be exported into a structure easily extracted using open-source parsing tools. Here, underlines are used for the title and author/s, highlighting is for annotations, and strikeouts marks text as a bookmark (i.e. read later). For example, exporting the PDF to Markdown results in the following data:
Underline [page 1]: Measures of physiological stress: a transparent or opaque window into the status, management and conservation of species?
Underline [page 1]: Ben Dantzer
Highlight [page 1]: Conservation physiology proposes that measures of physiological stress (glucocorticoid levels) can be used to assess the status and future fate of natural populations.
Highlight [page 1]: chronic increases in glucocorticoids can have detrimental effects on survival and reproduction, which could influence the viability of populations.
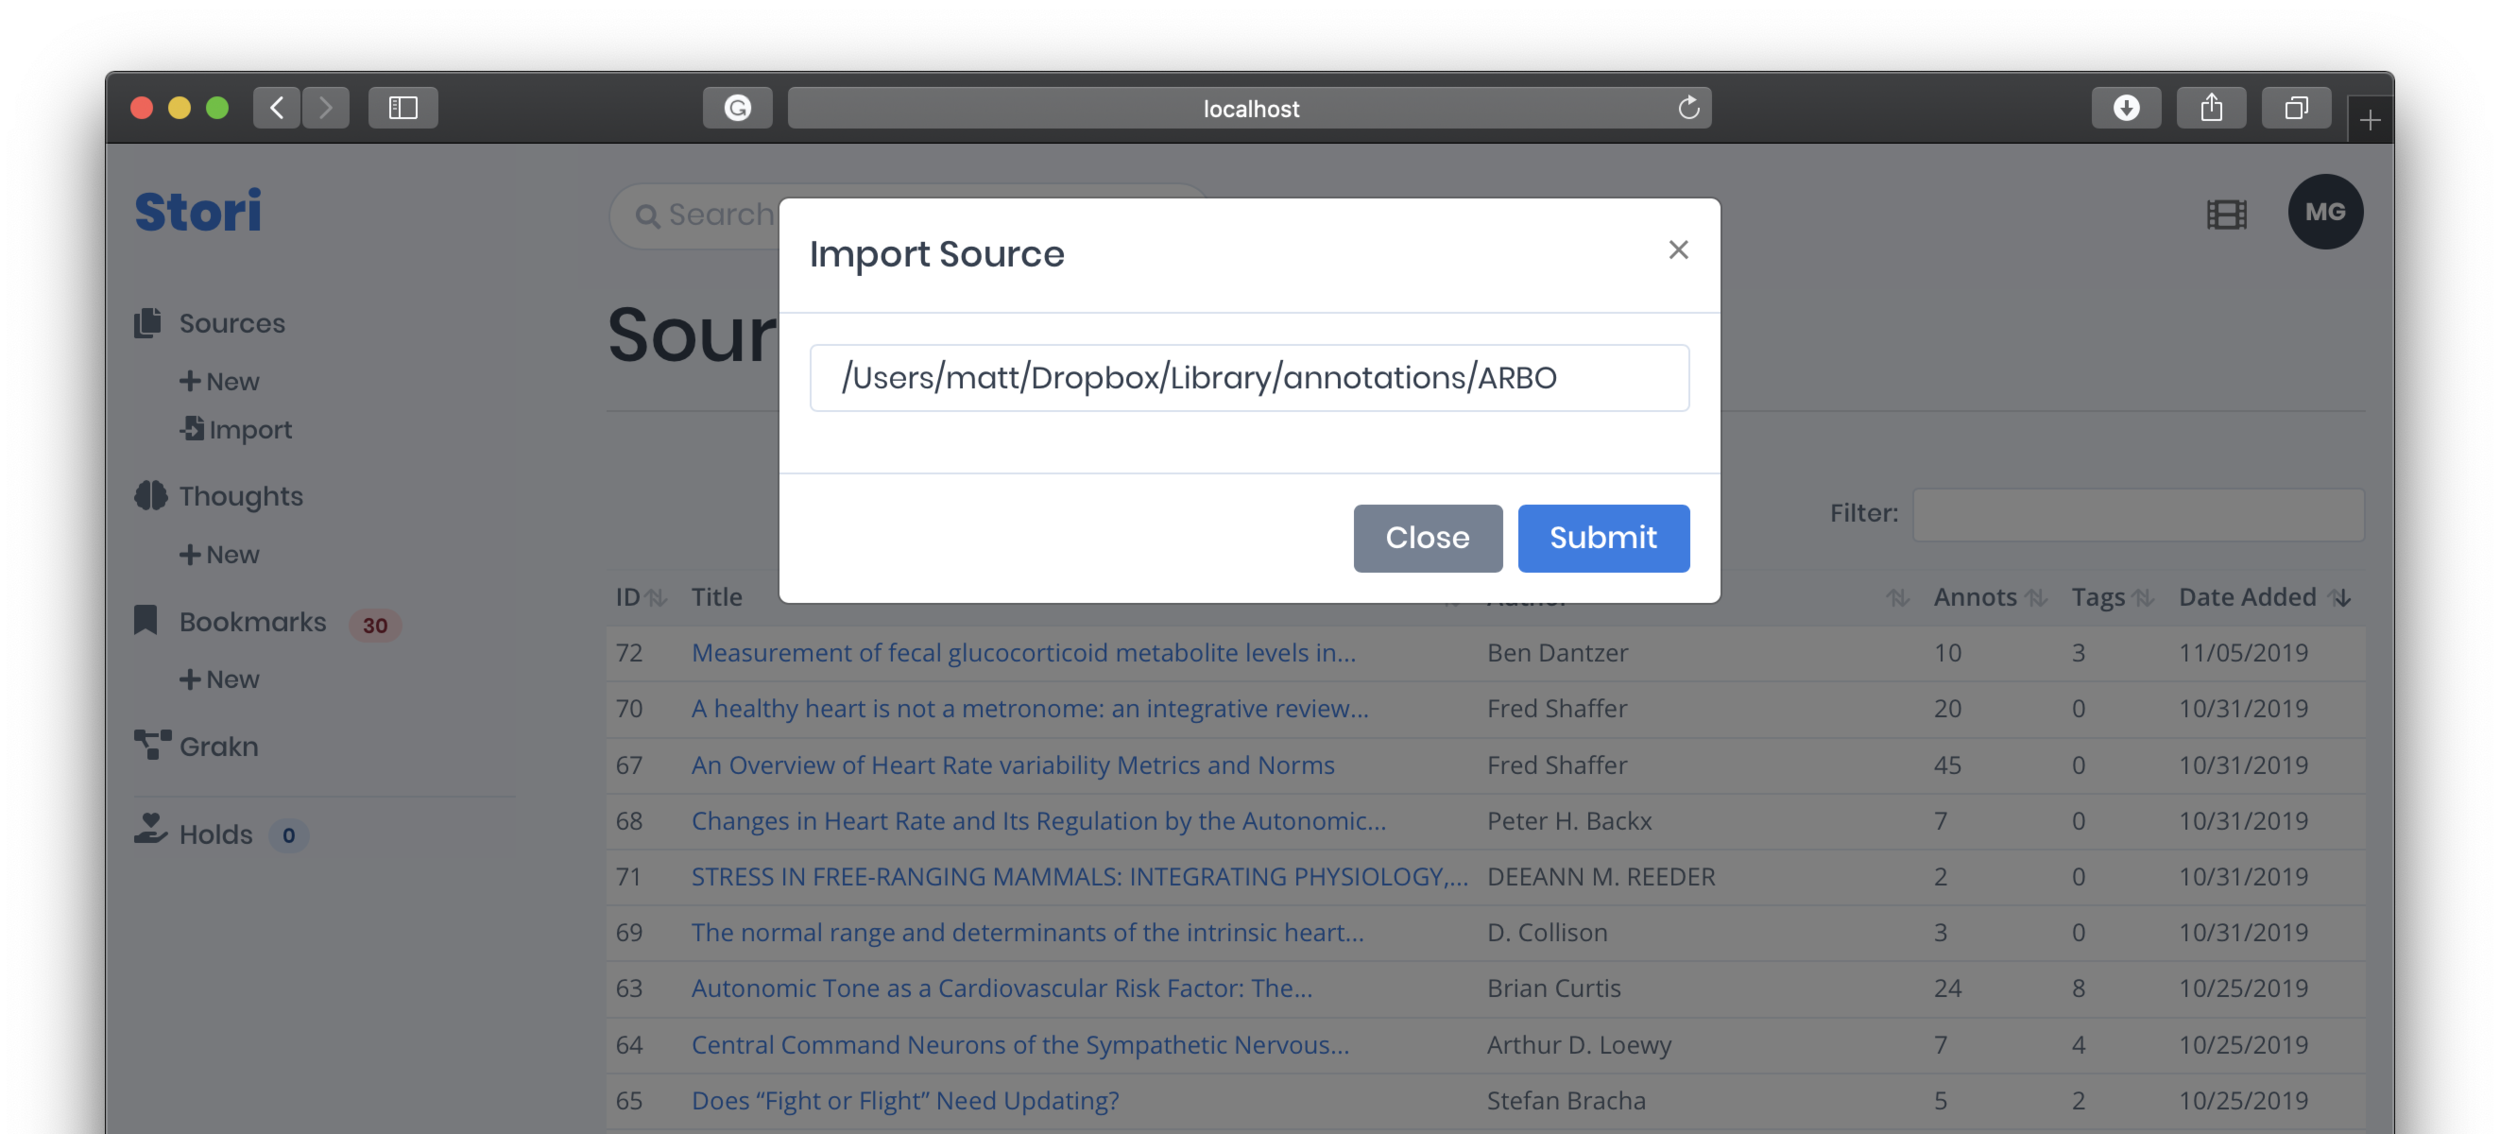
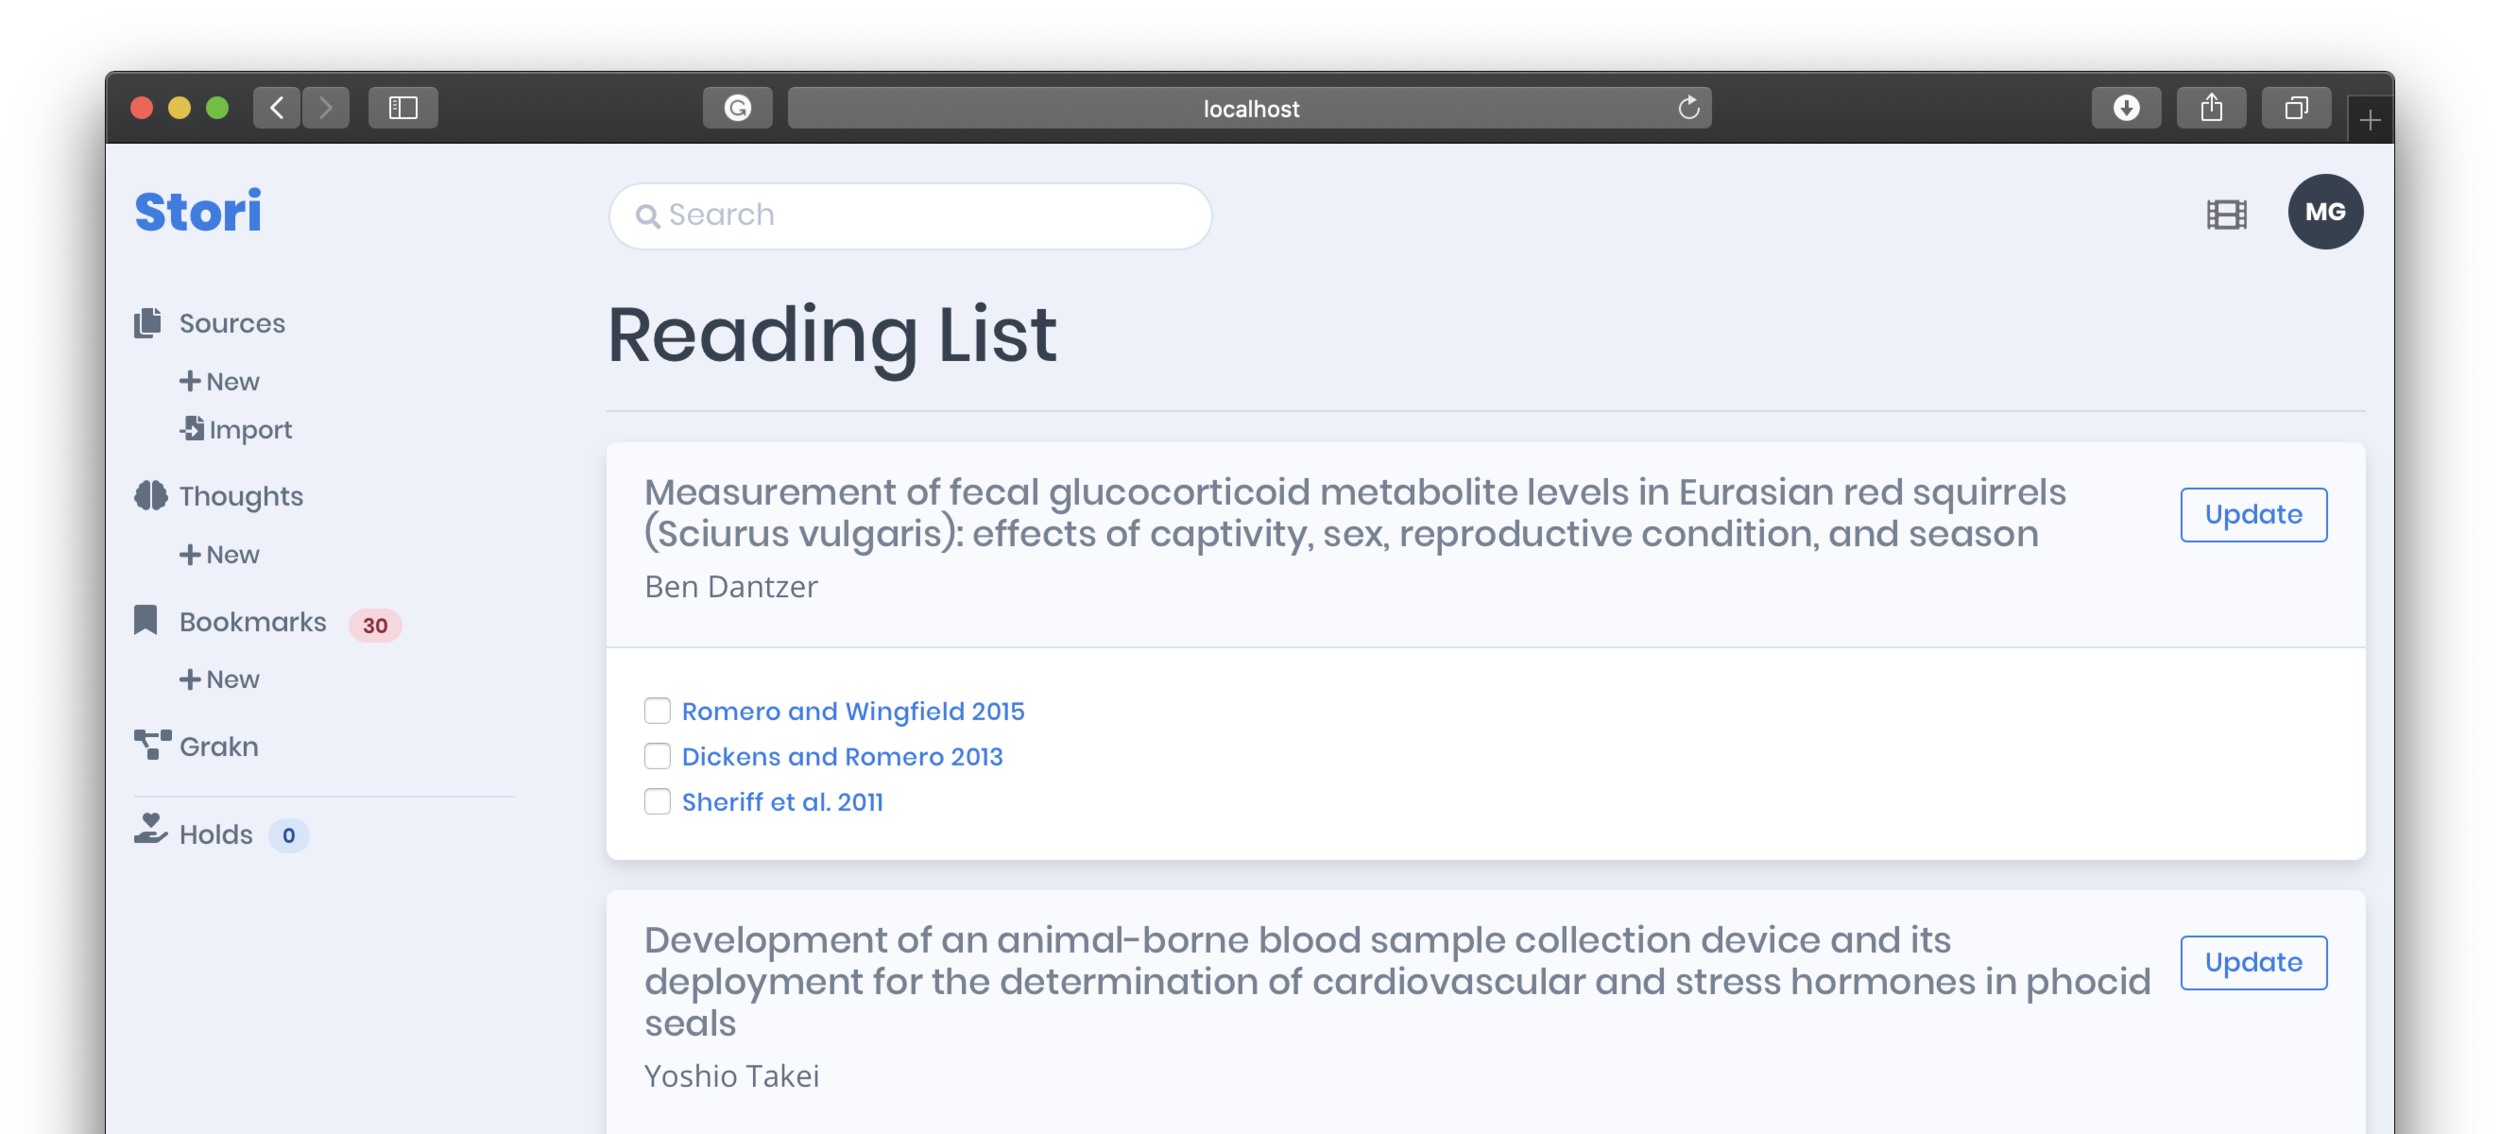
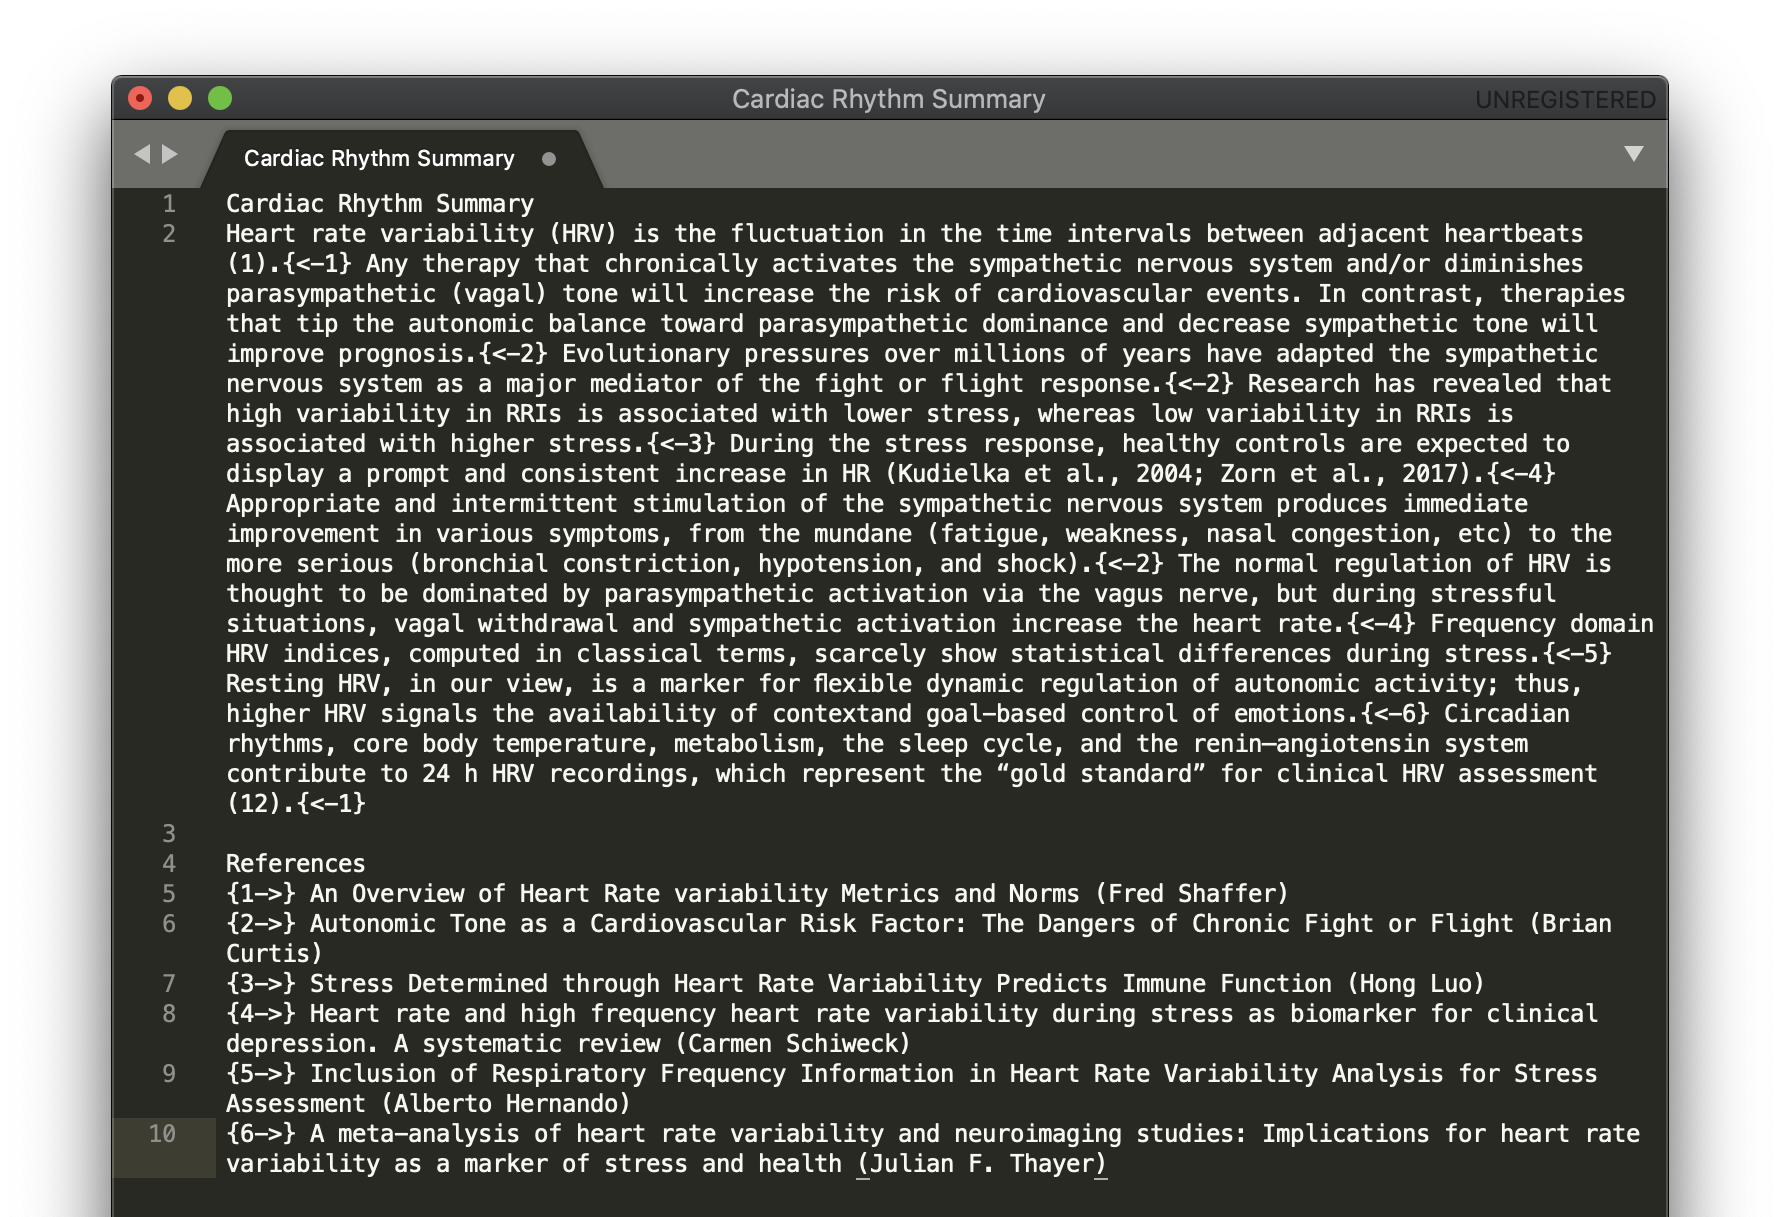
Stori is the tool I built to gather and organize sources and annotations. The gallery below shows the workflow for importing Markdown files and viewing their data, in addition to several attributes that can be associated with the source data itself.
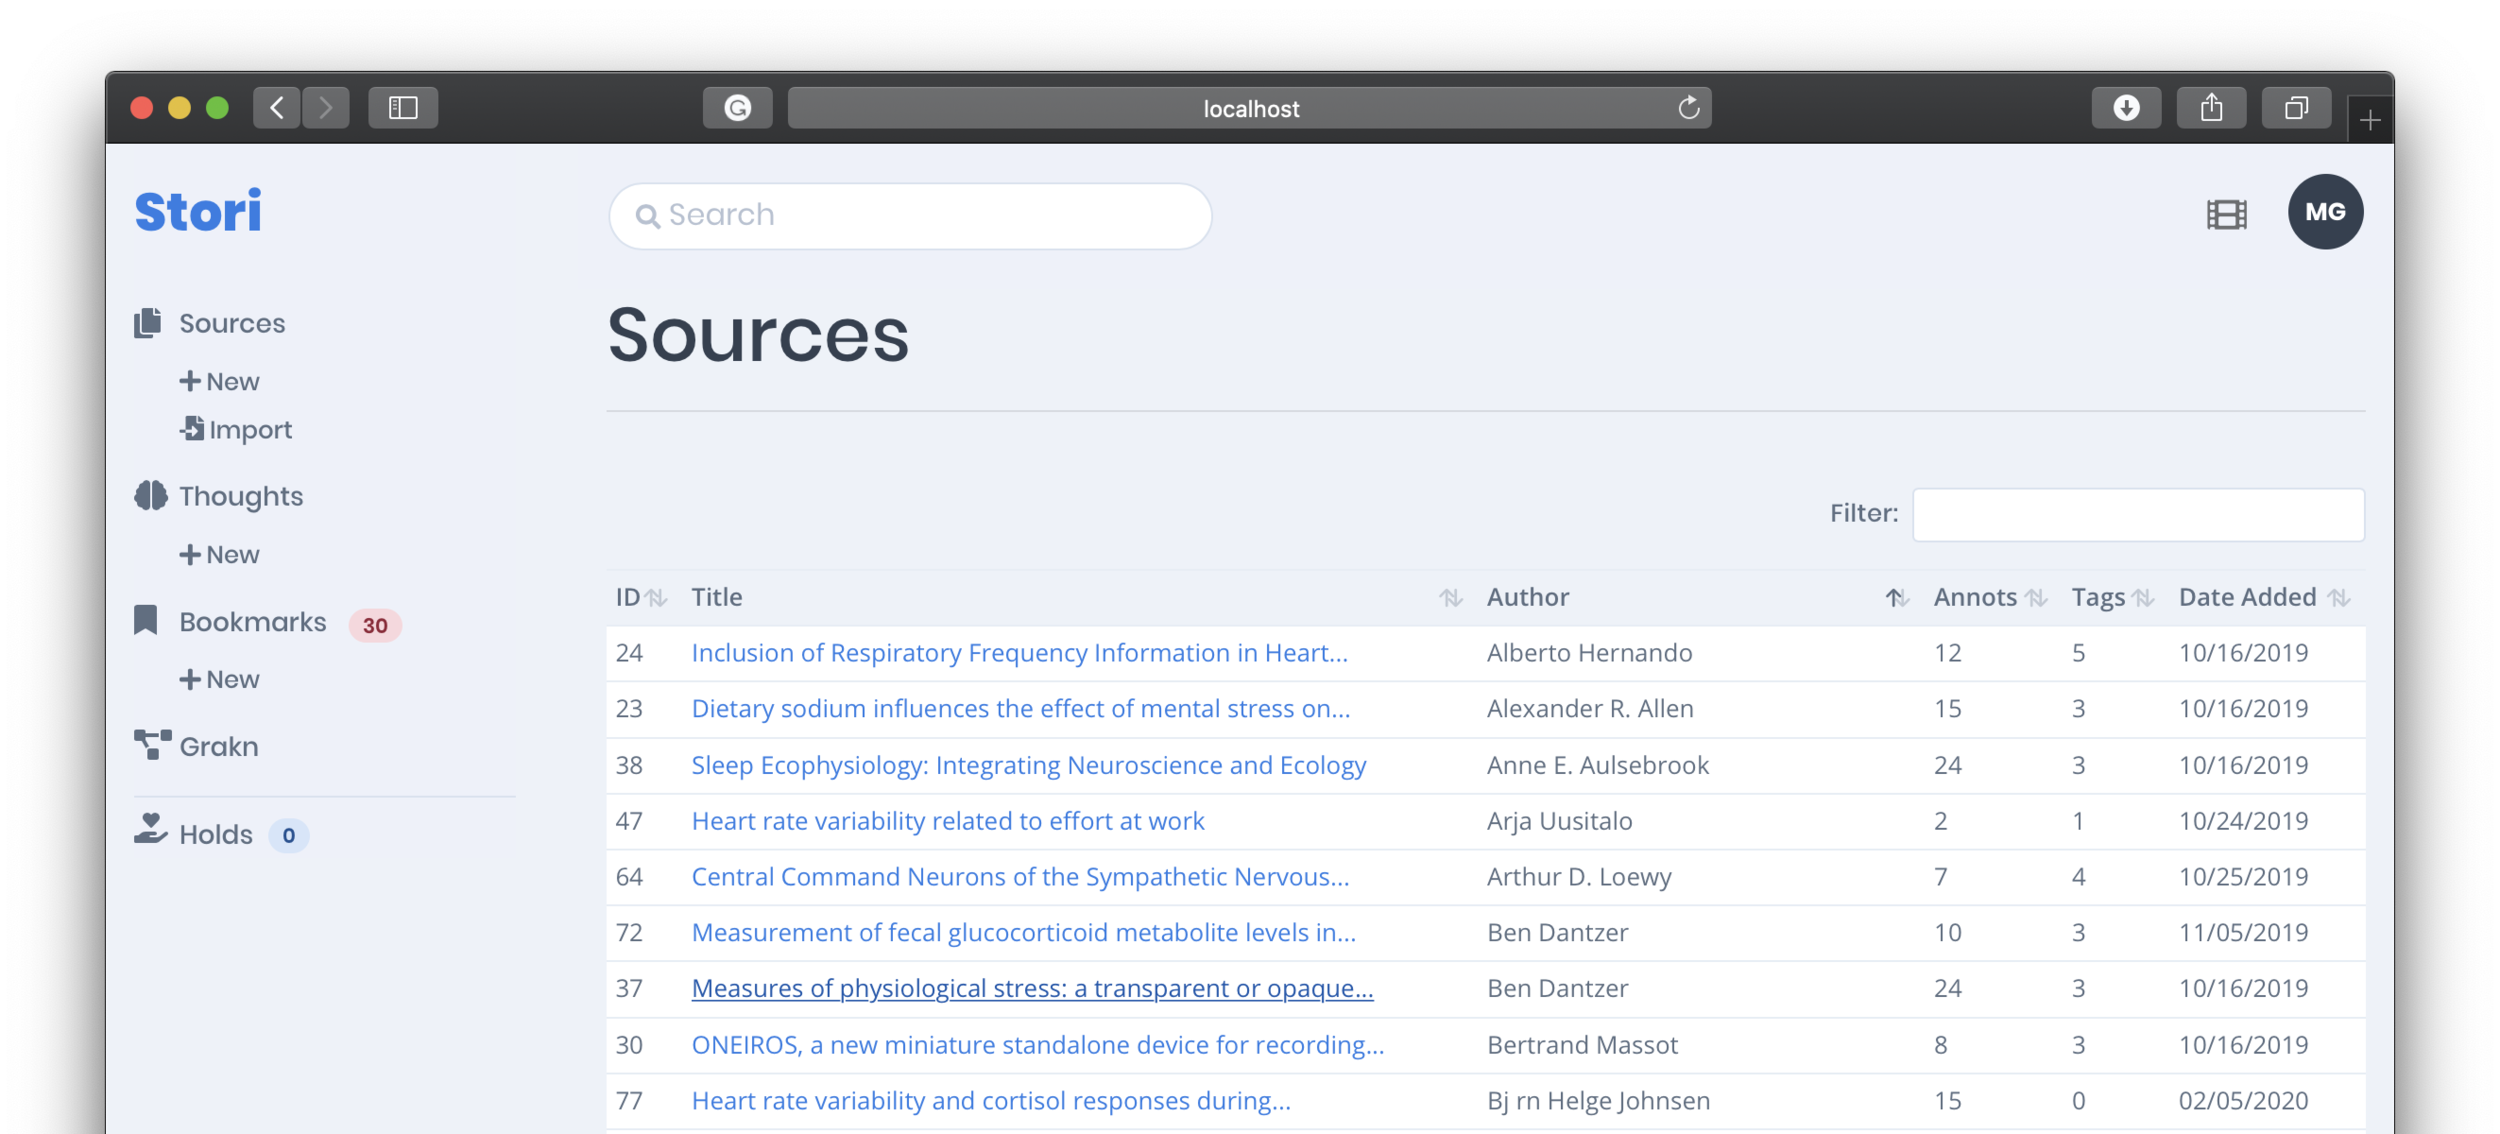
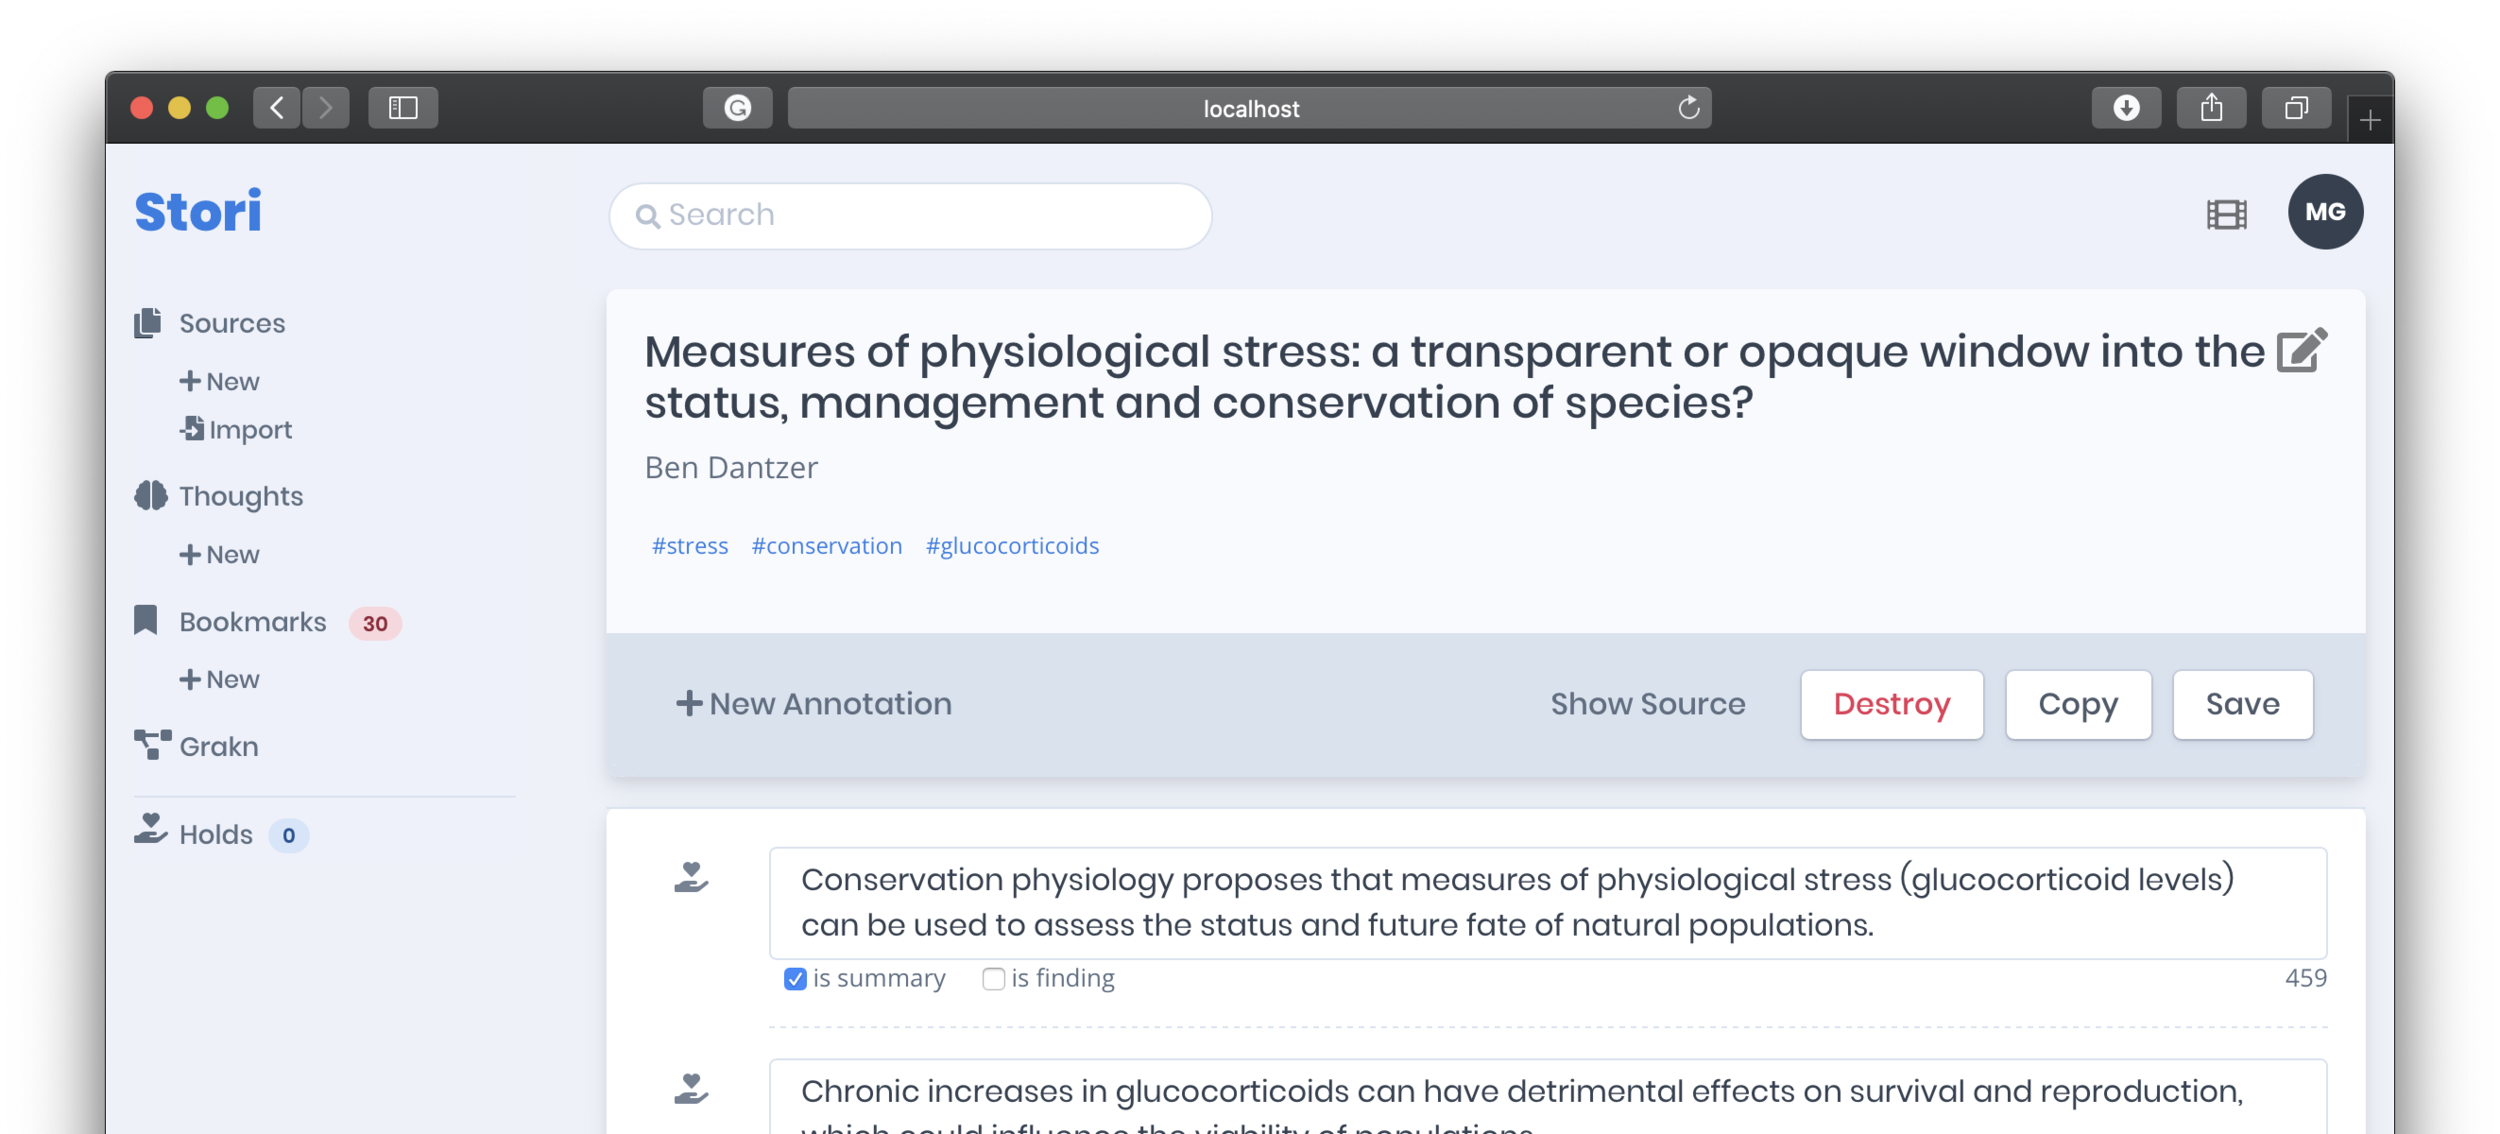
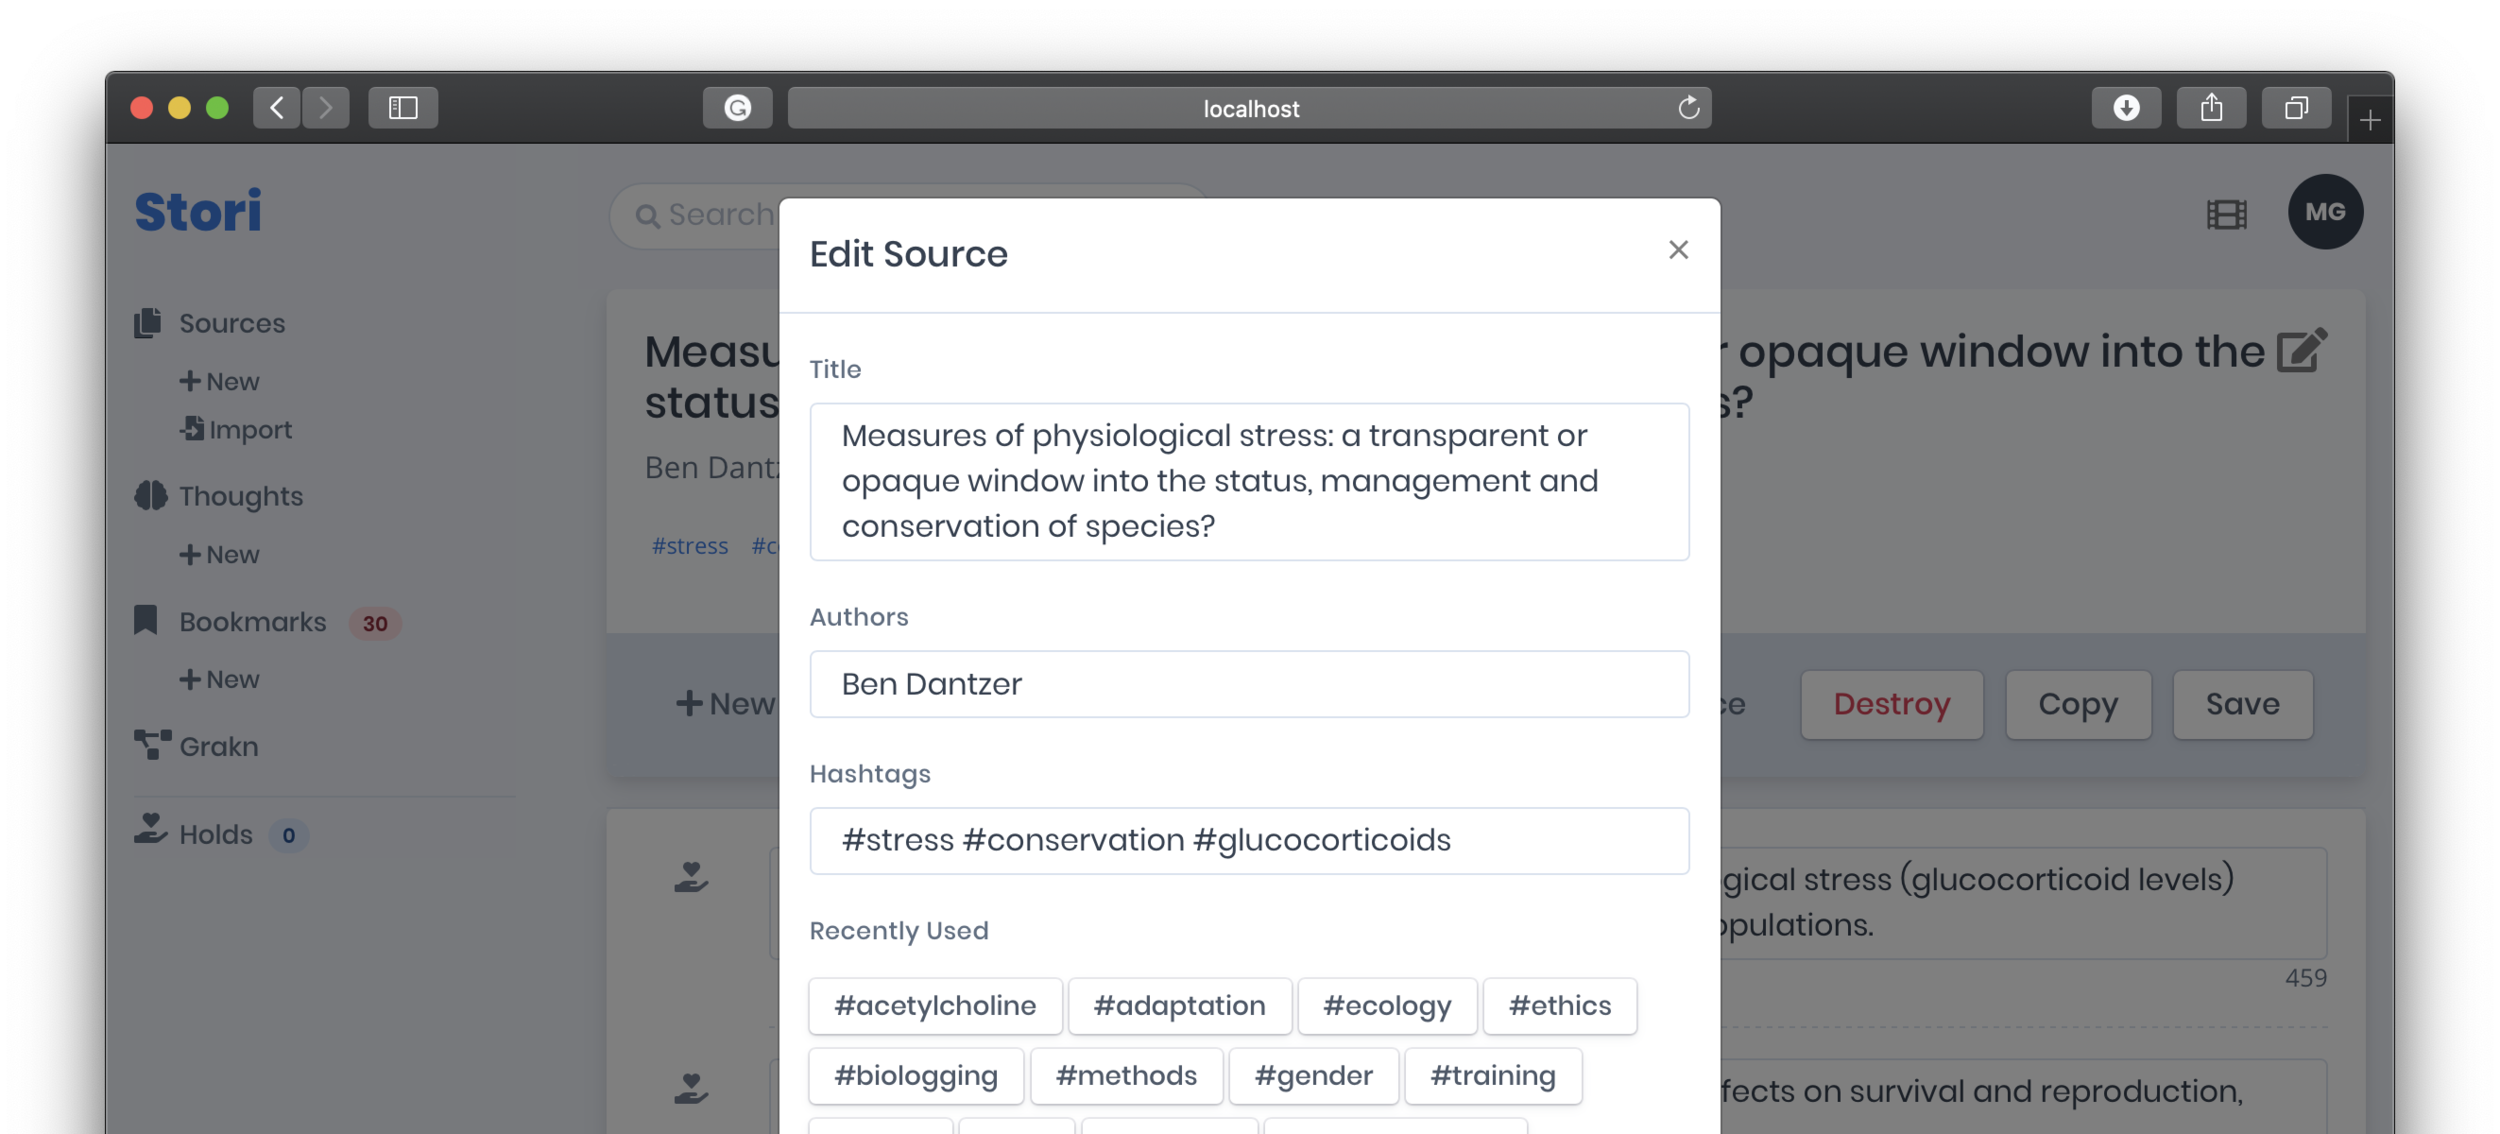
Curated annotations establish a personal knowledge base. Consolidating annotations is not novel but it creates a unique ability to add metadata both to the source (#tags) and annotations (is_summary and is_finding). This also enables a more meaningful search mechanism.
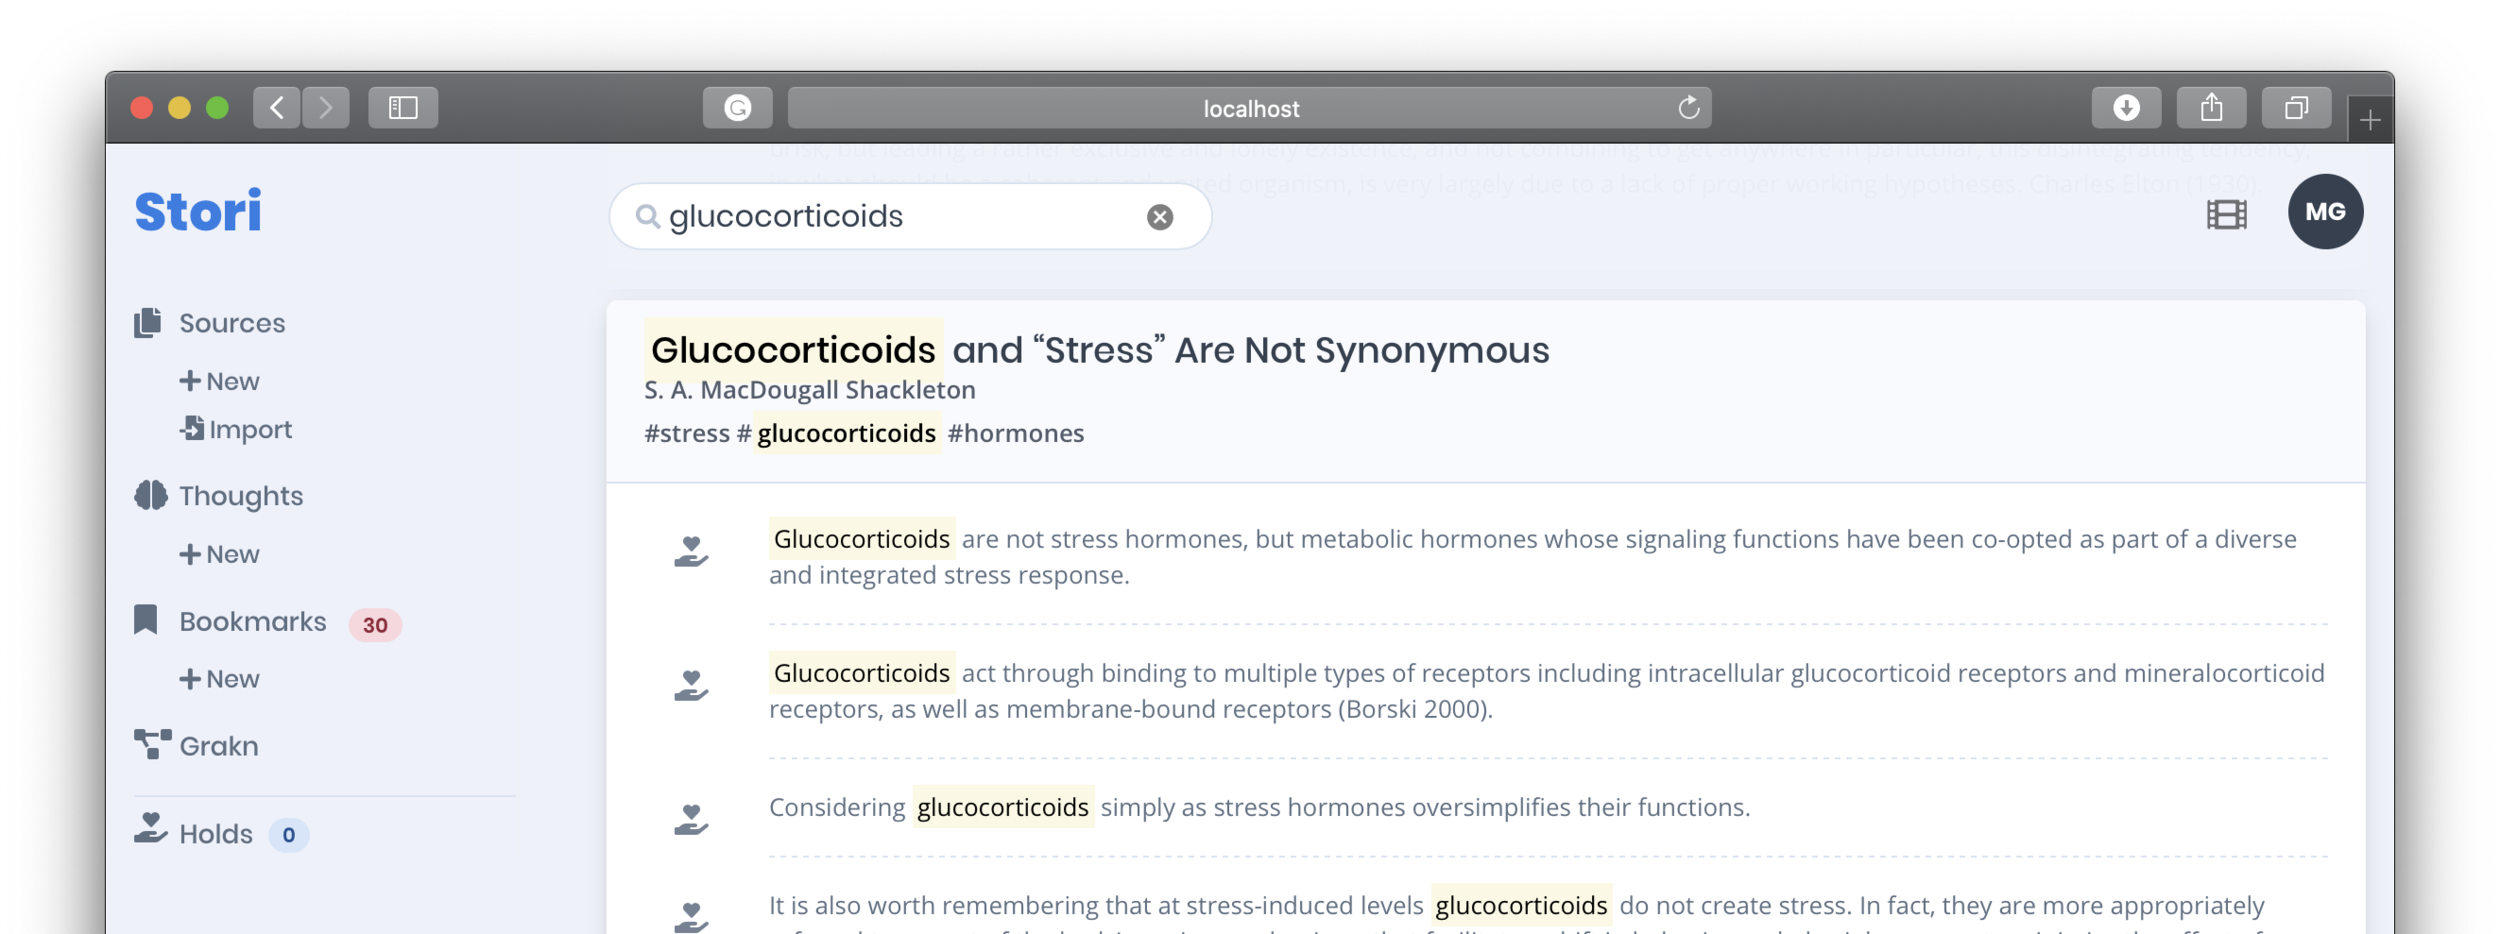
Searching your knowledge base.
This function could be accomplished within other systems with a filter like, search: in:annotations glucocorticoids. However, the first novel power of Stori is to begin threading a narrative using your knowledge base. This is done by “holding” annotations (by clicking the hand icon)—as a form of temporary memory—then dumping those into Thoughts.
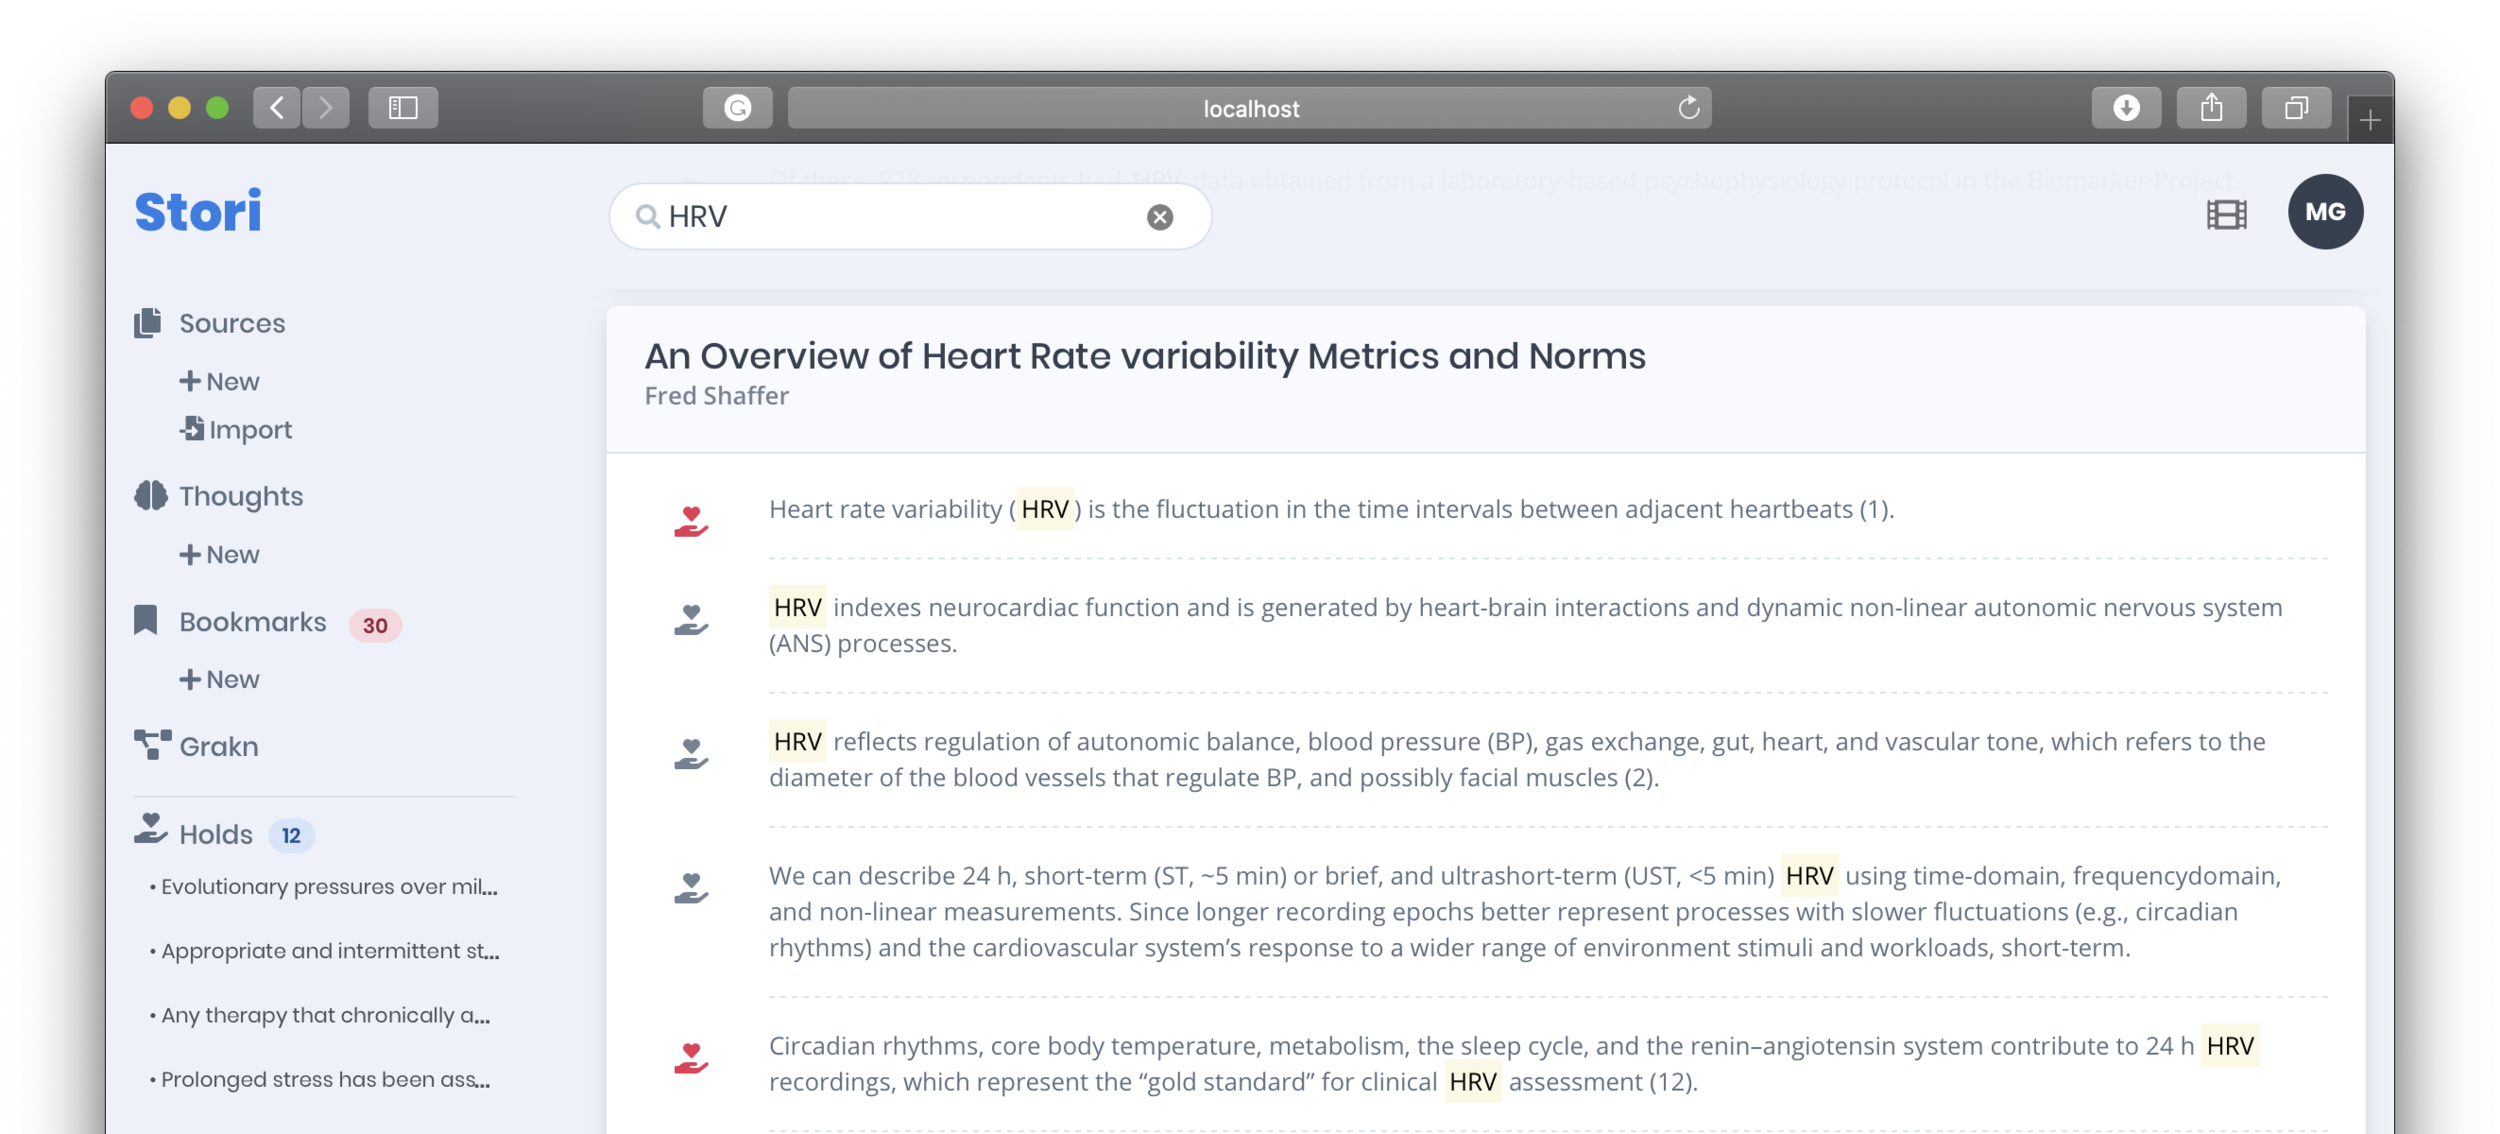
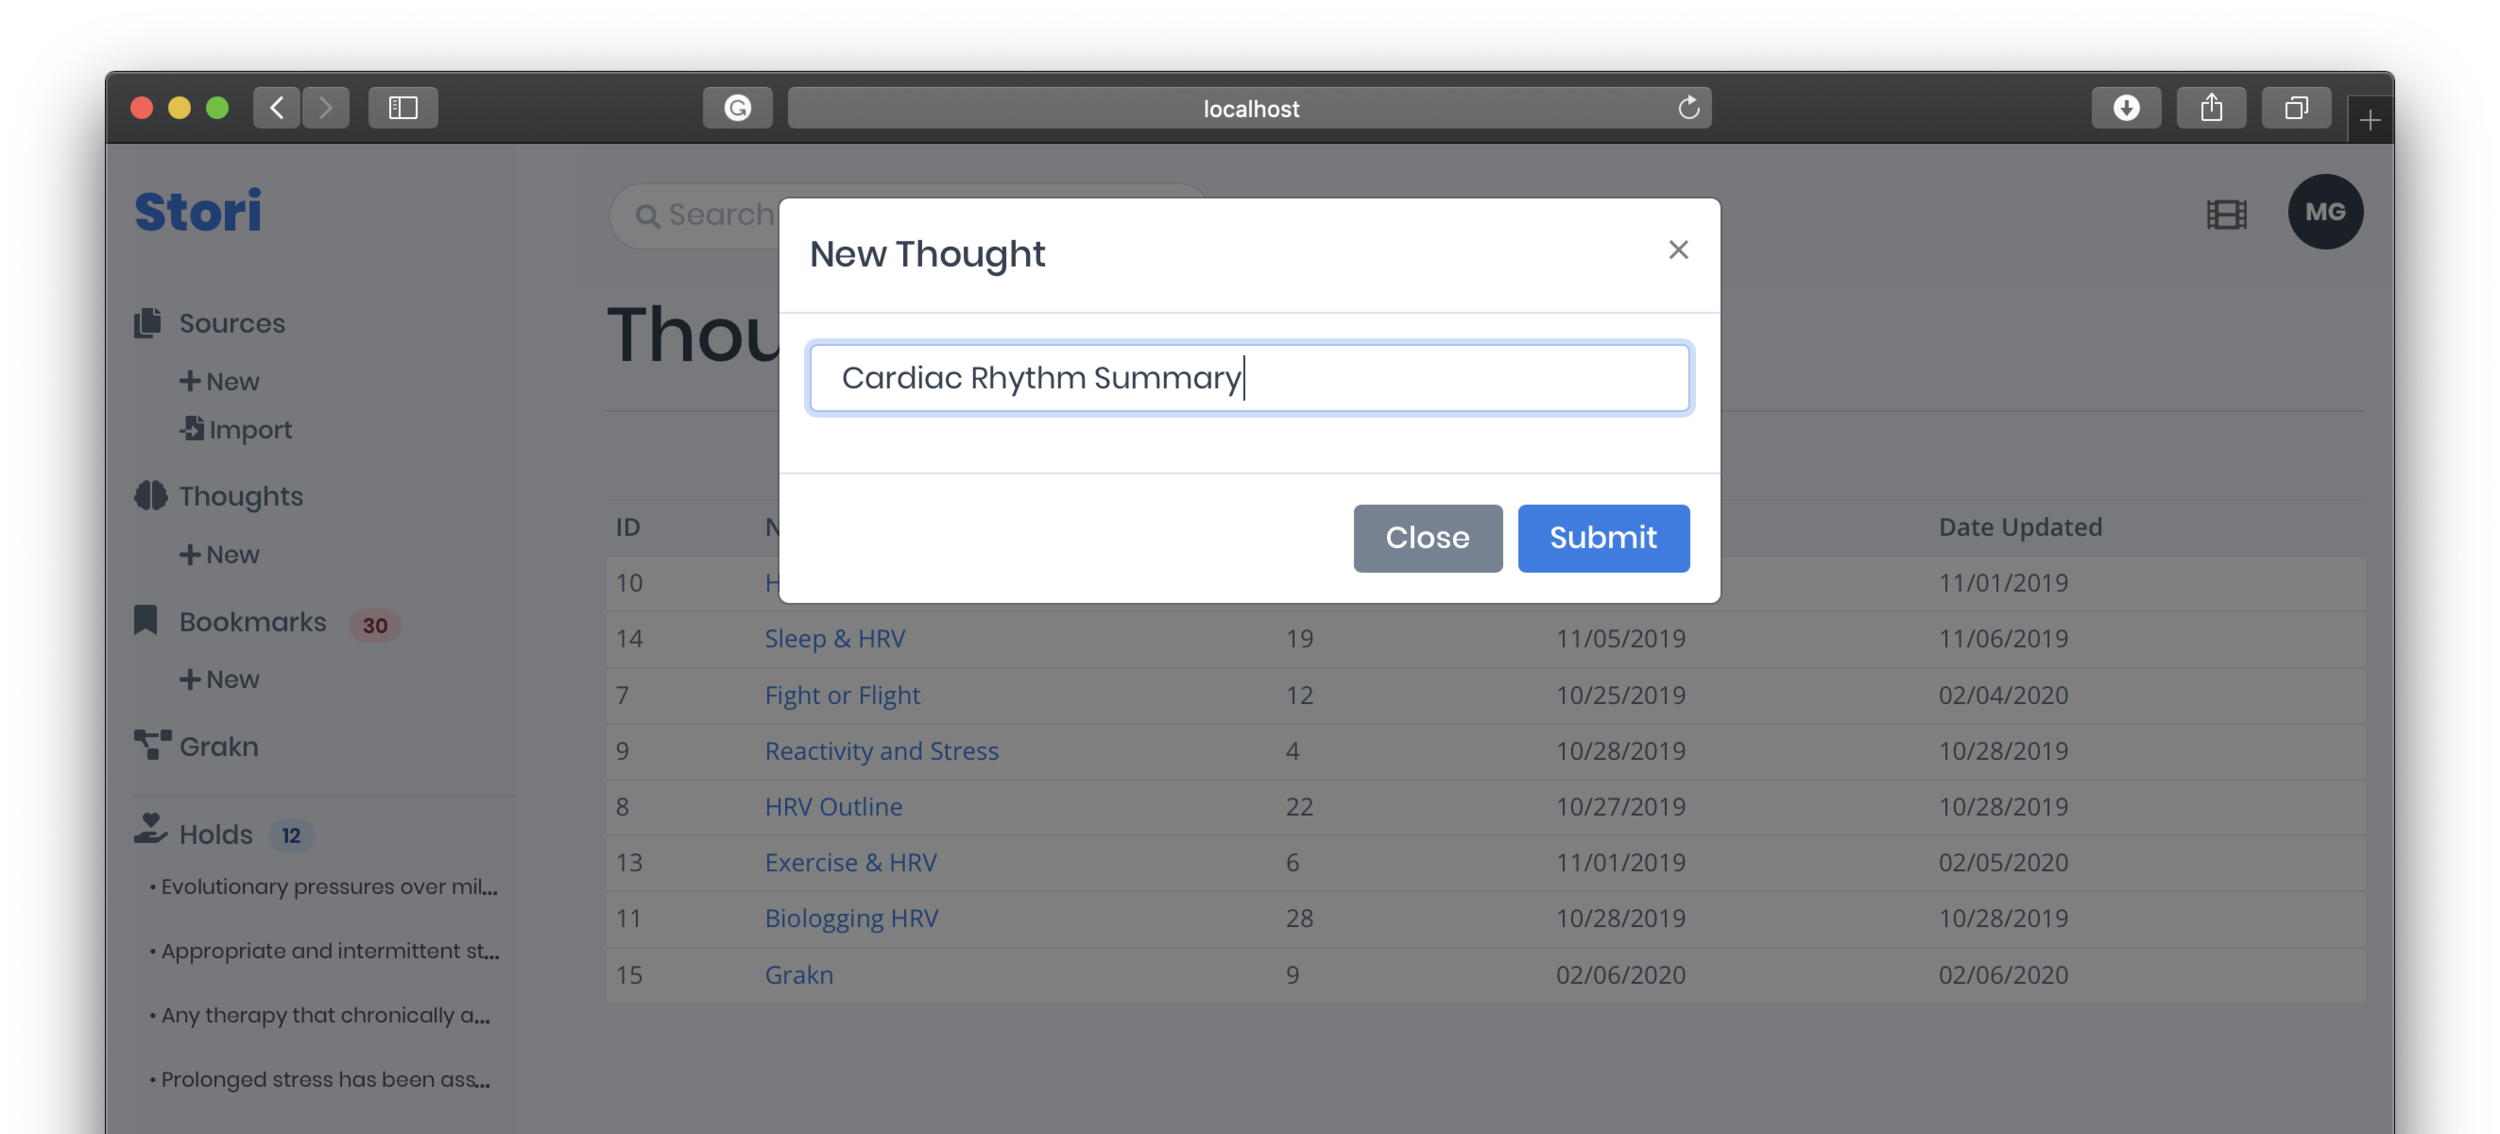
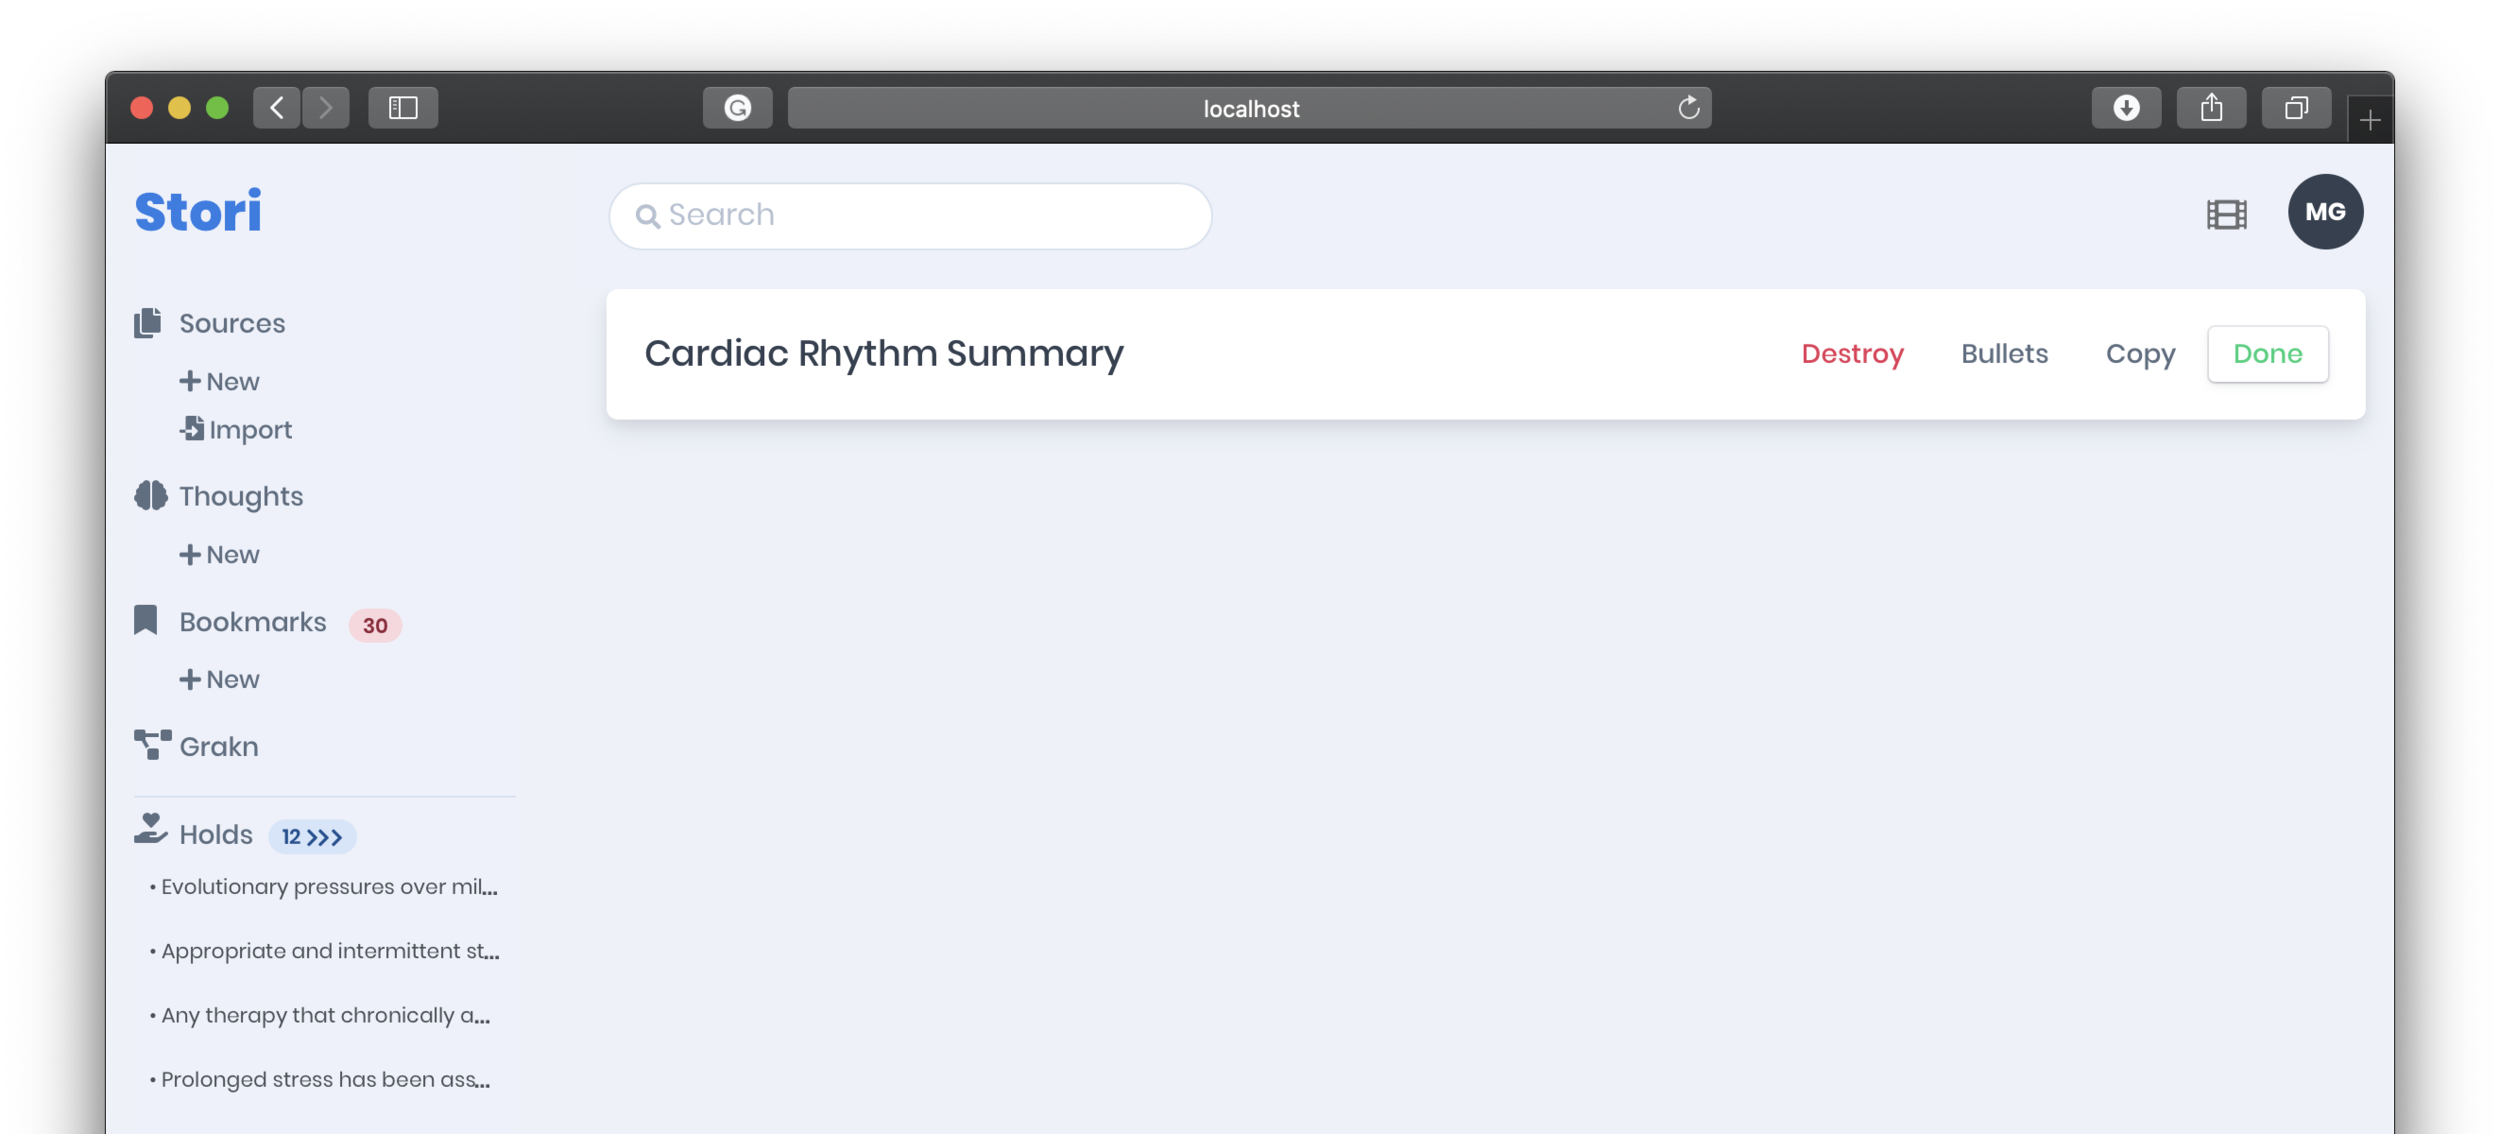
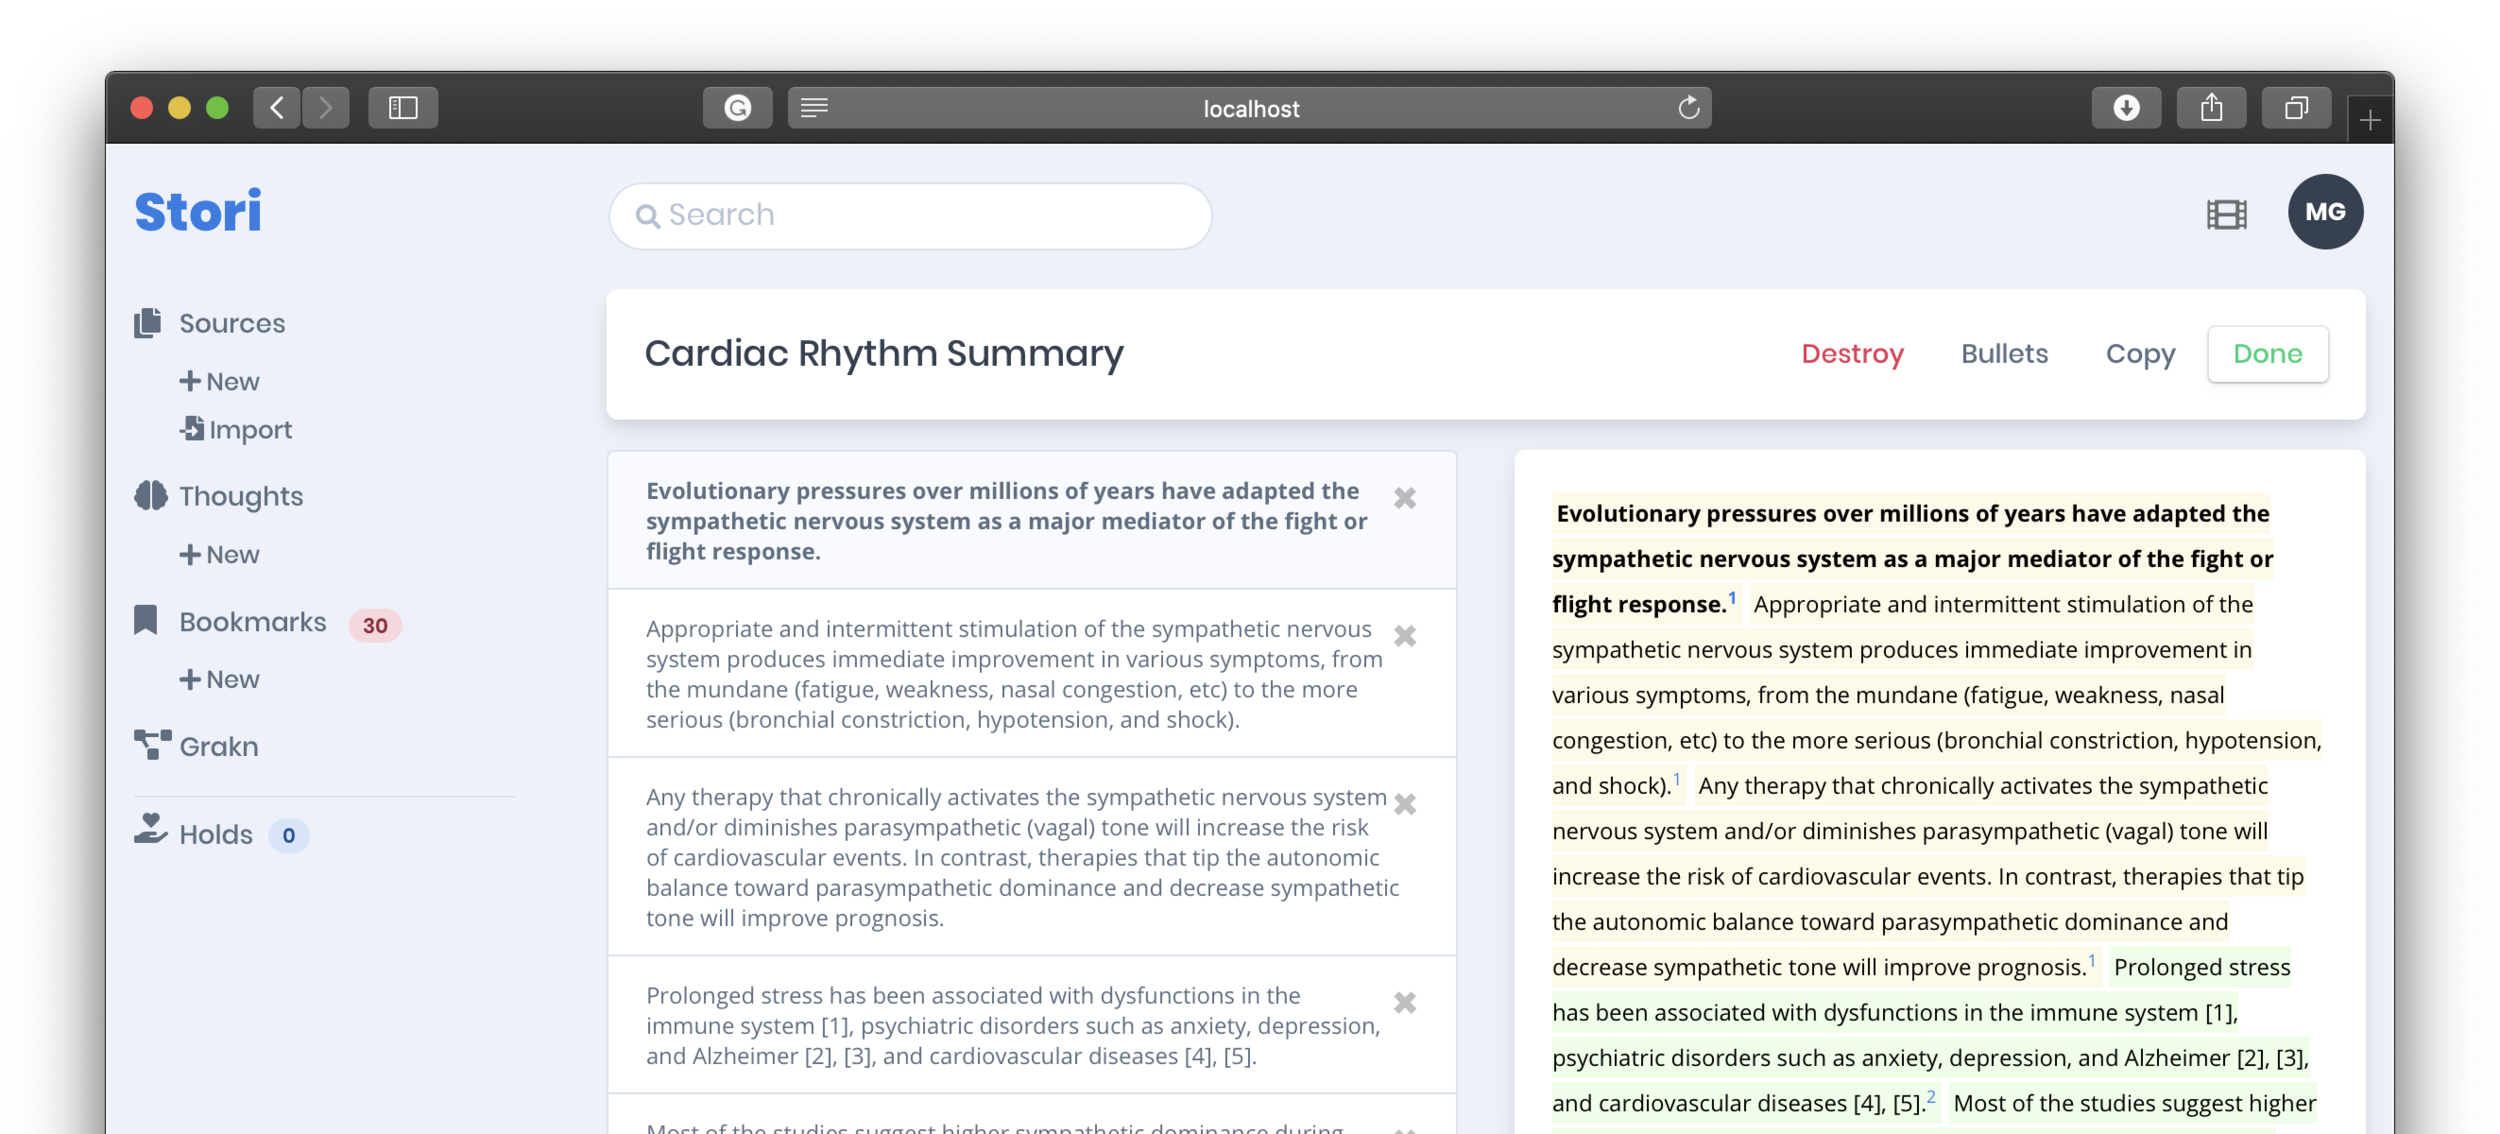
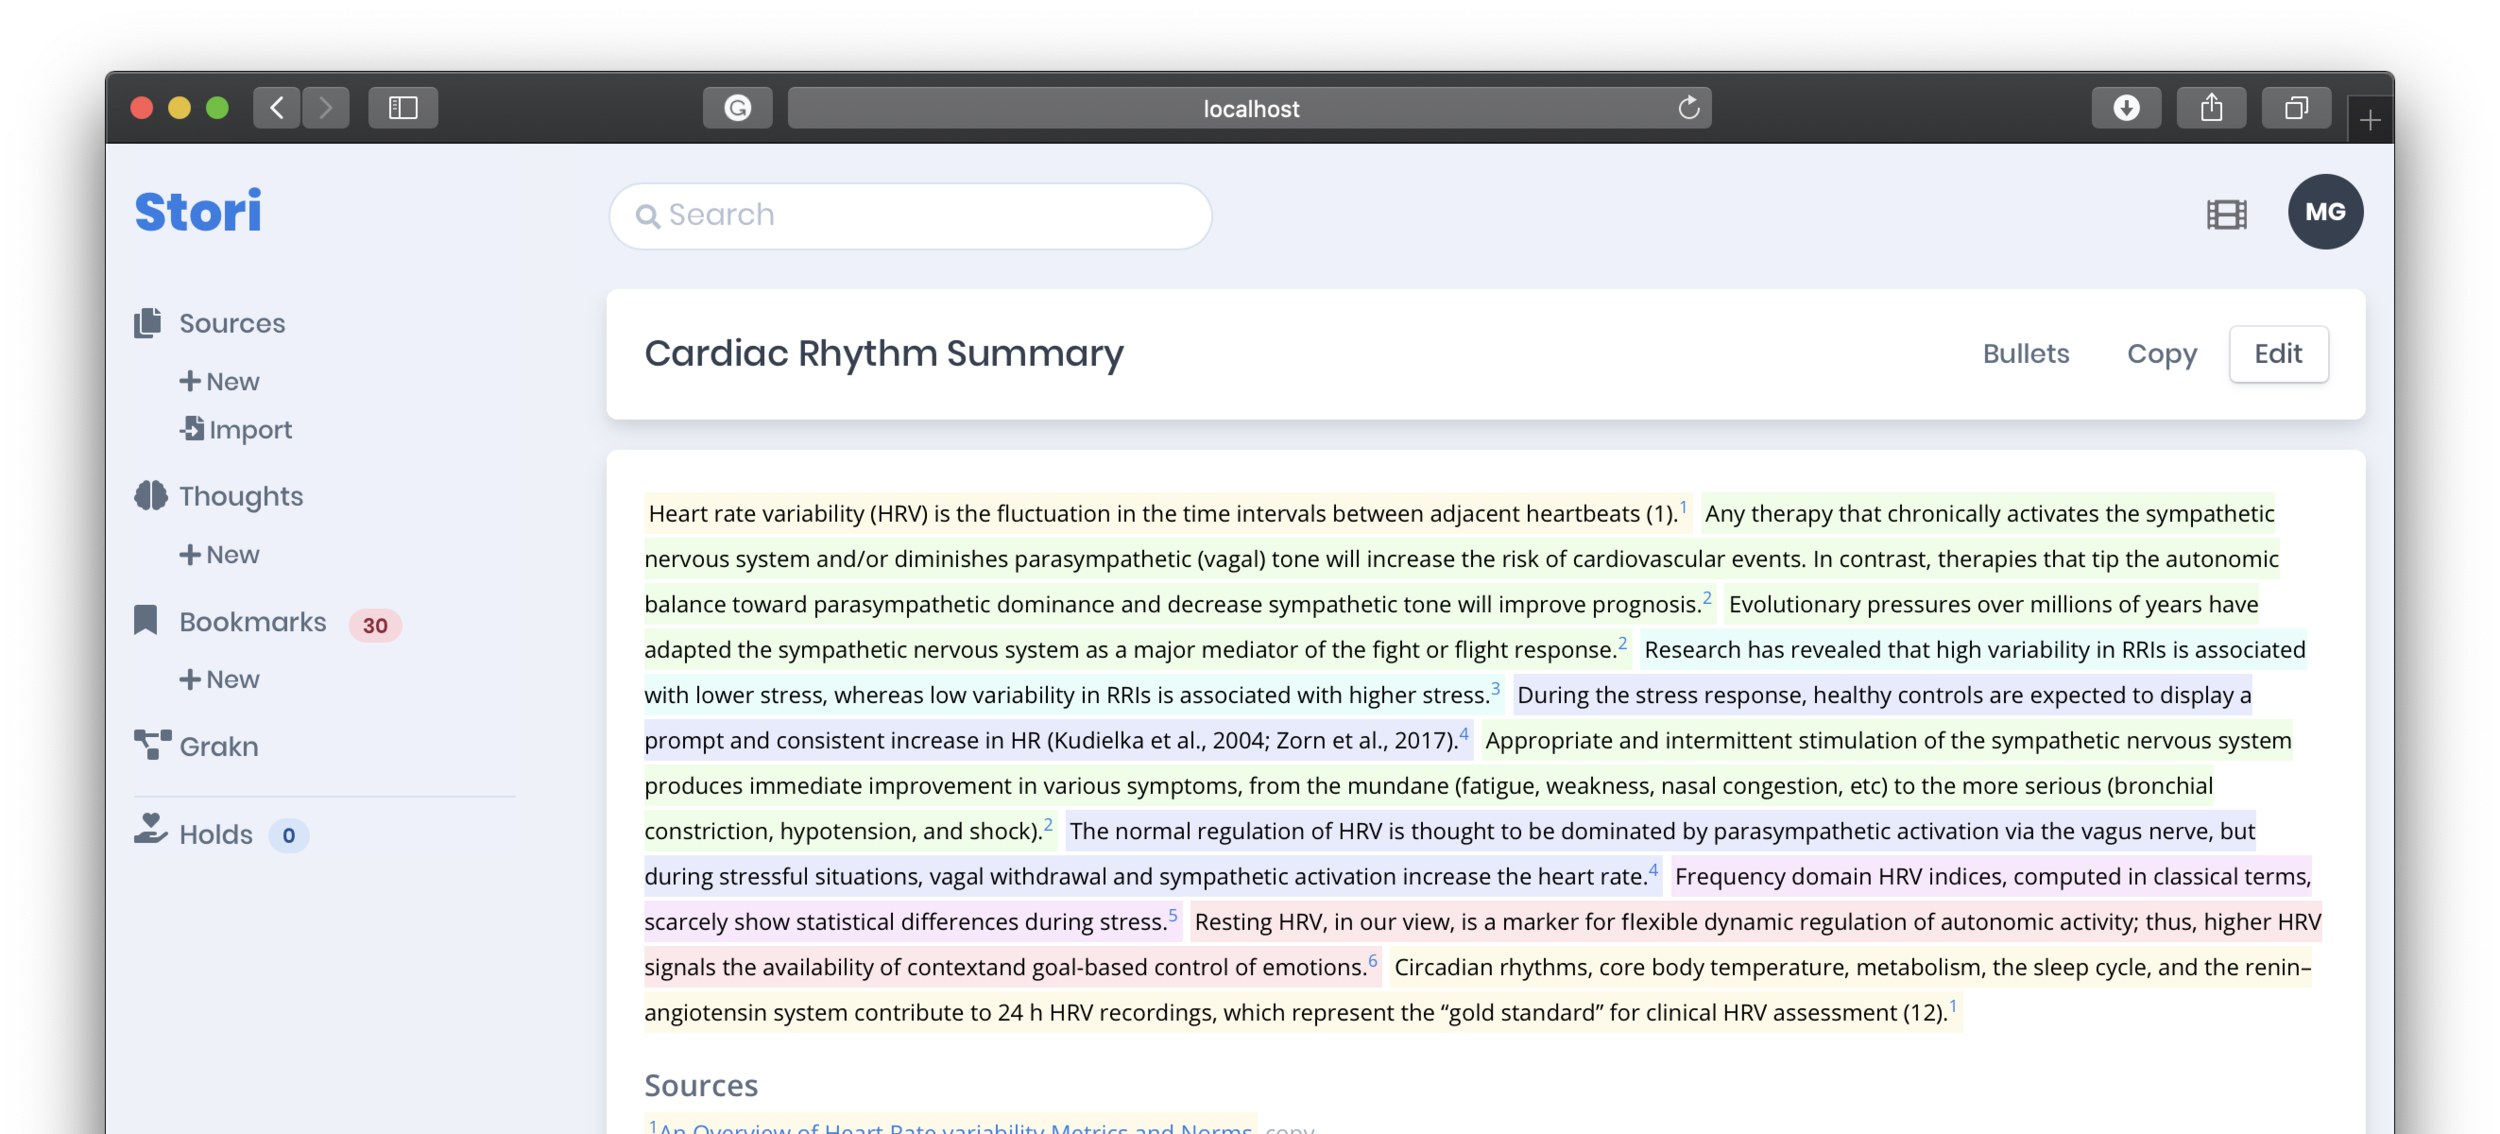
Thoughts are not just a conglomeration of [potentially] many annotations from many sources but are easily rearranged (drag-and-drop) to form a short story. Thoughts are easily copied and pasted into emails or could be made available through a shareable link. This speeds up summary development that is often (and sometimes should be) based on cited literature.
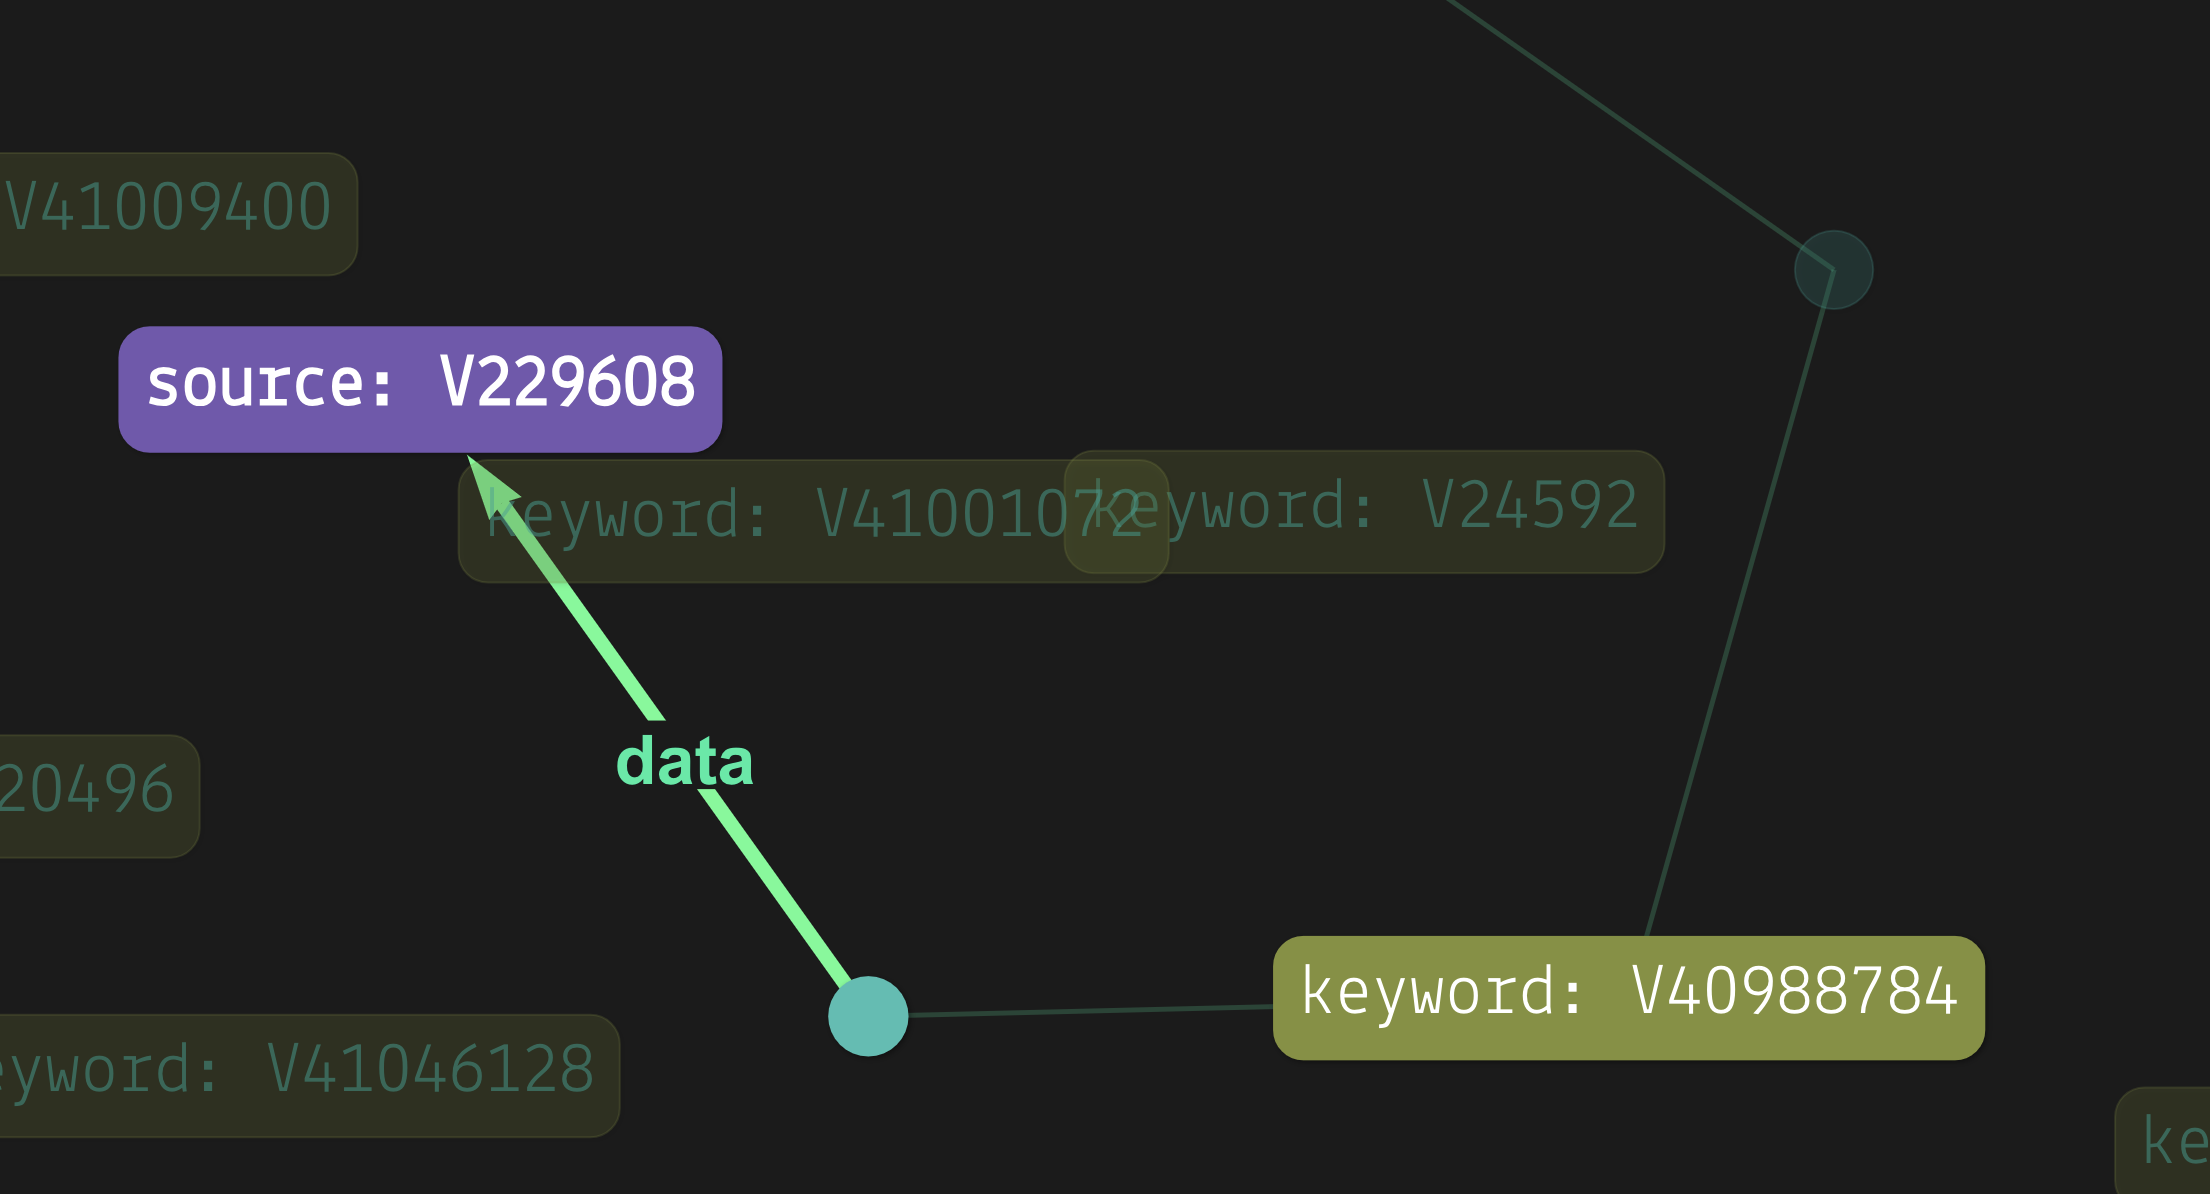
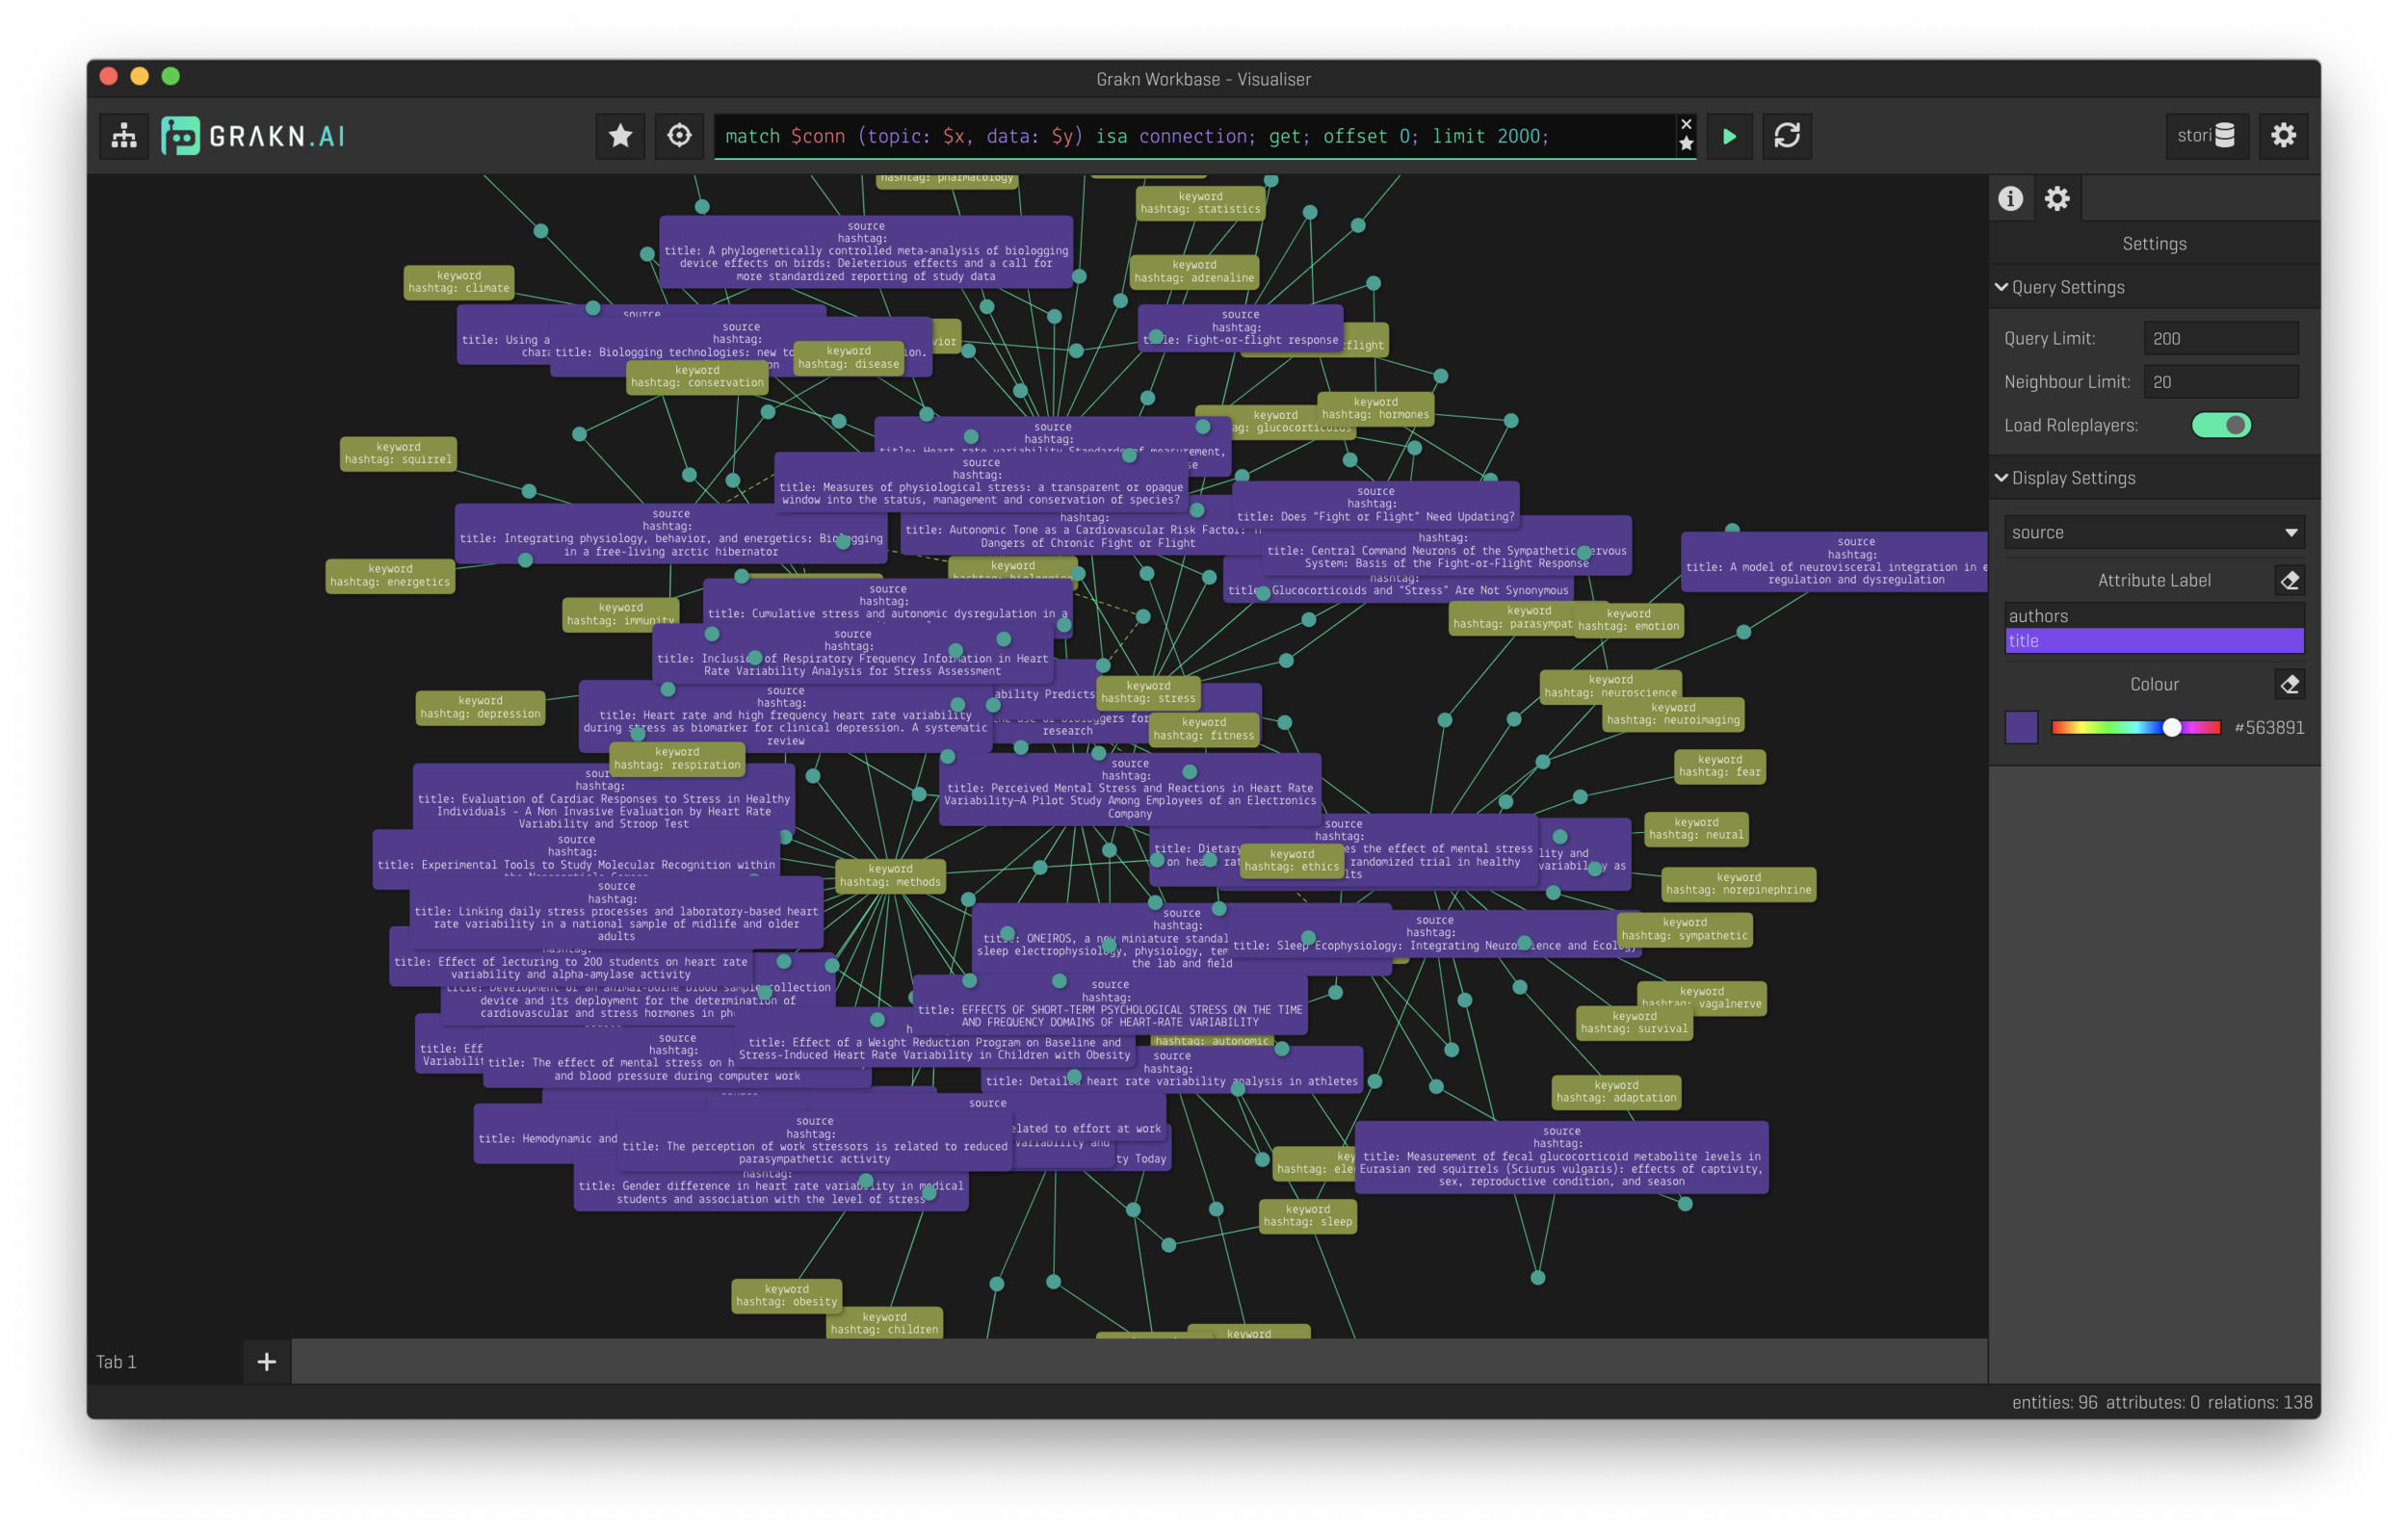
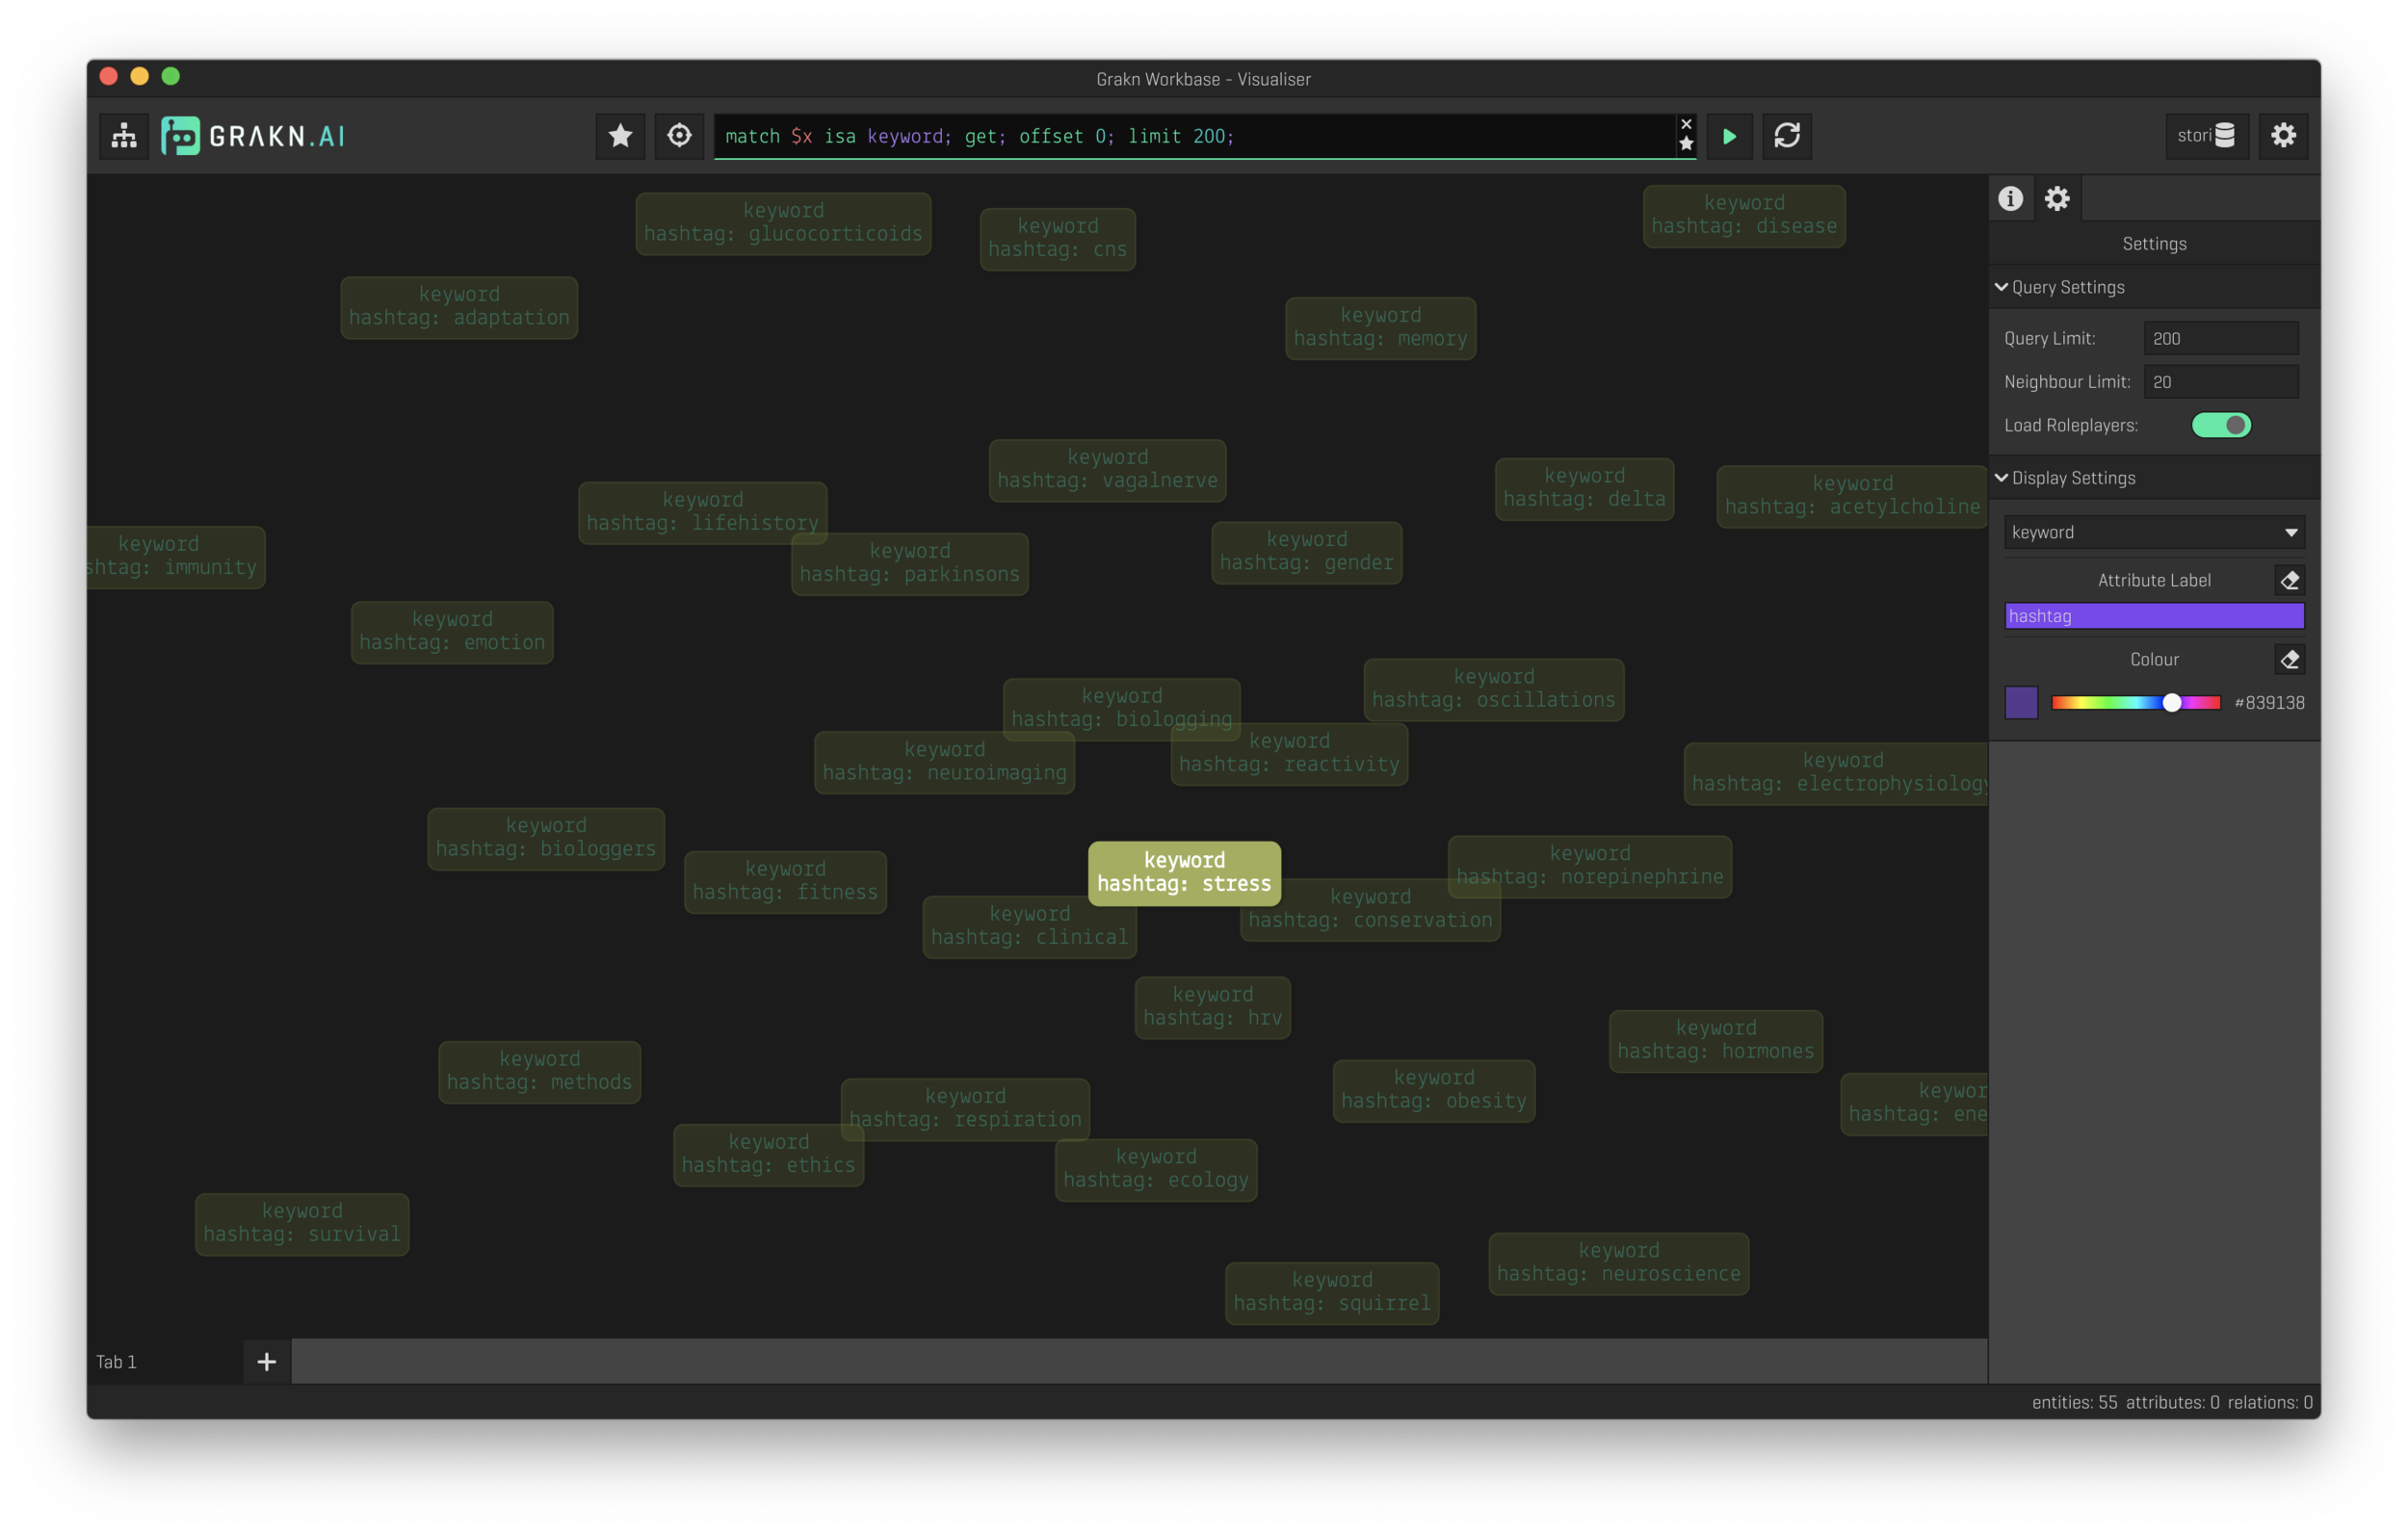
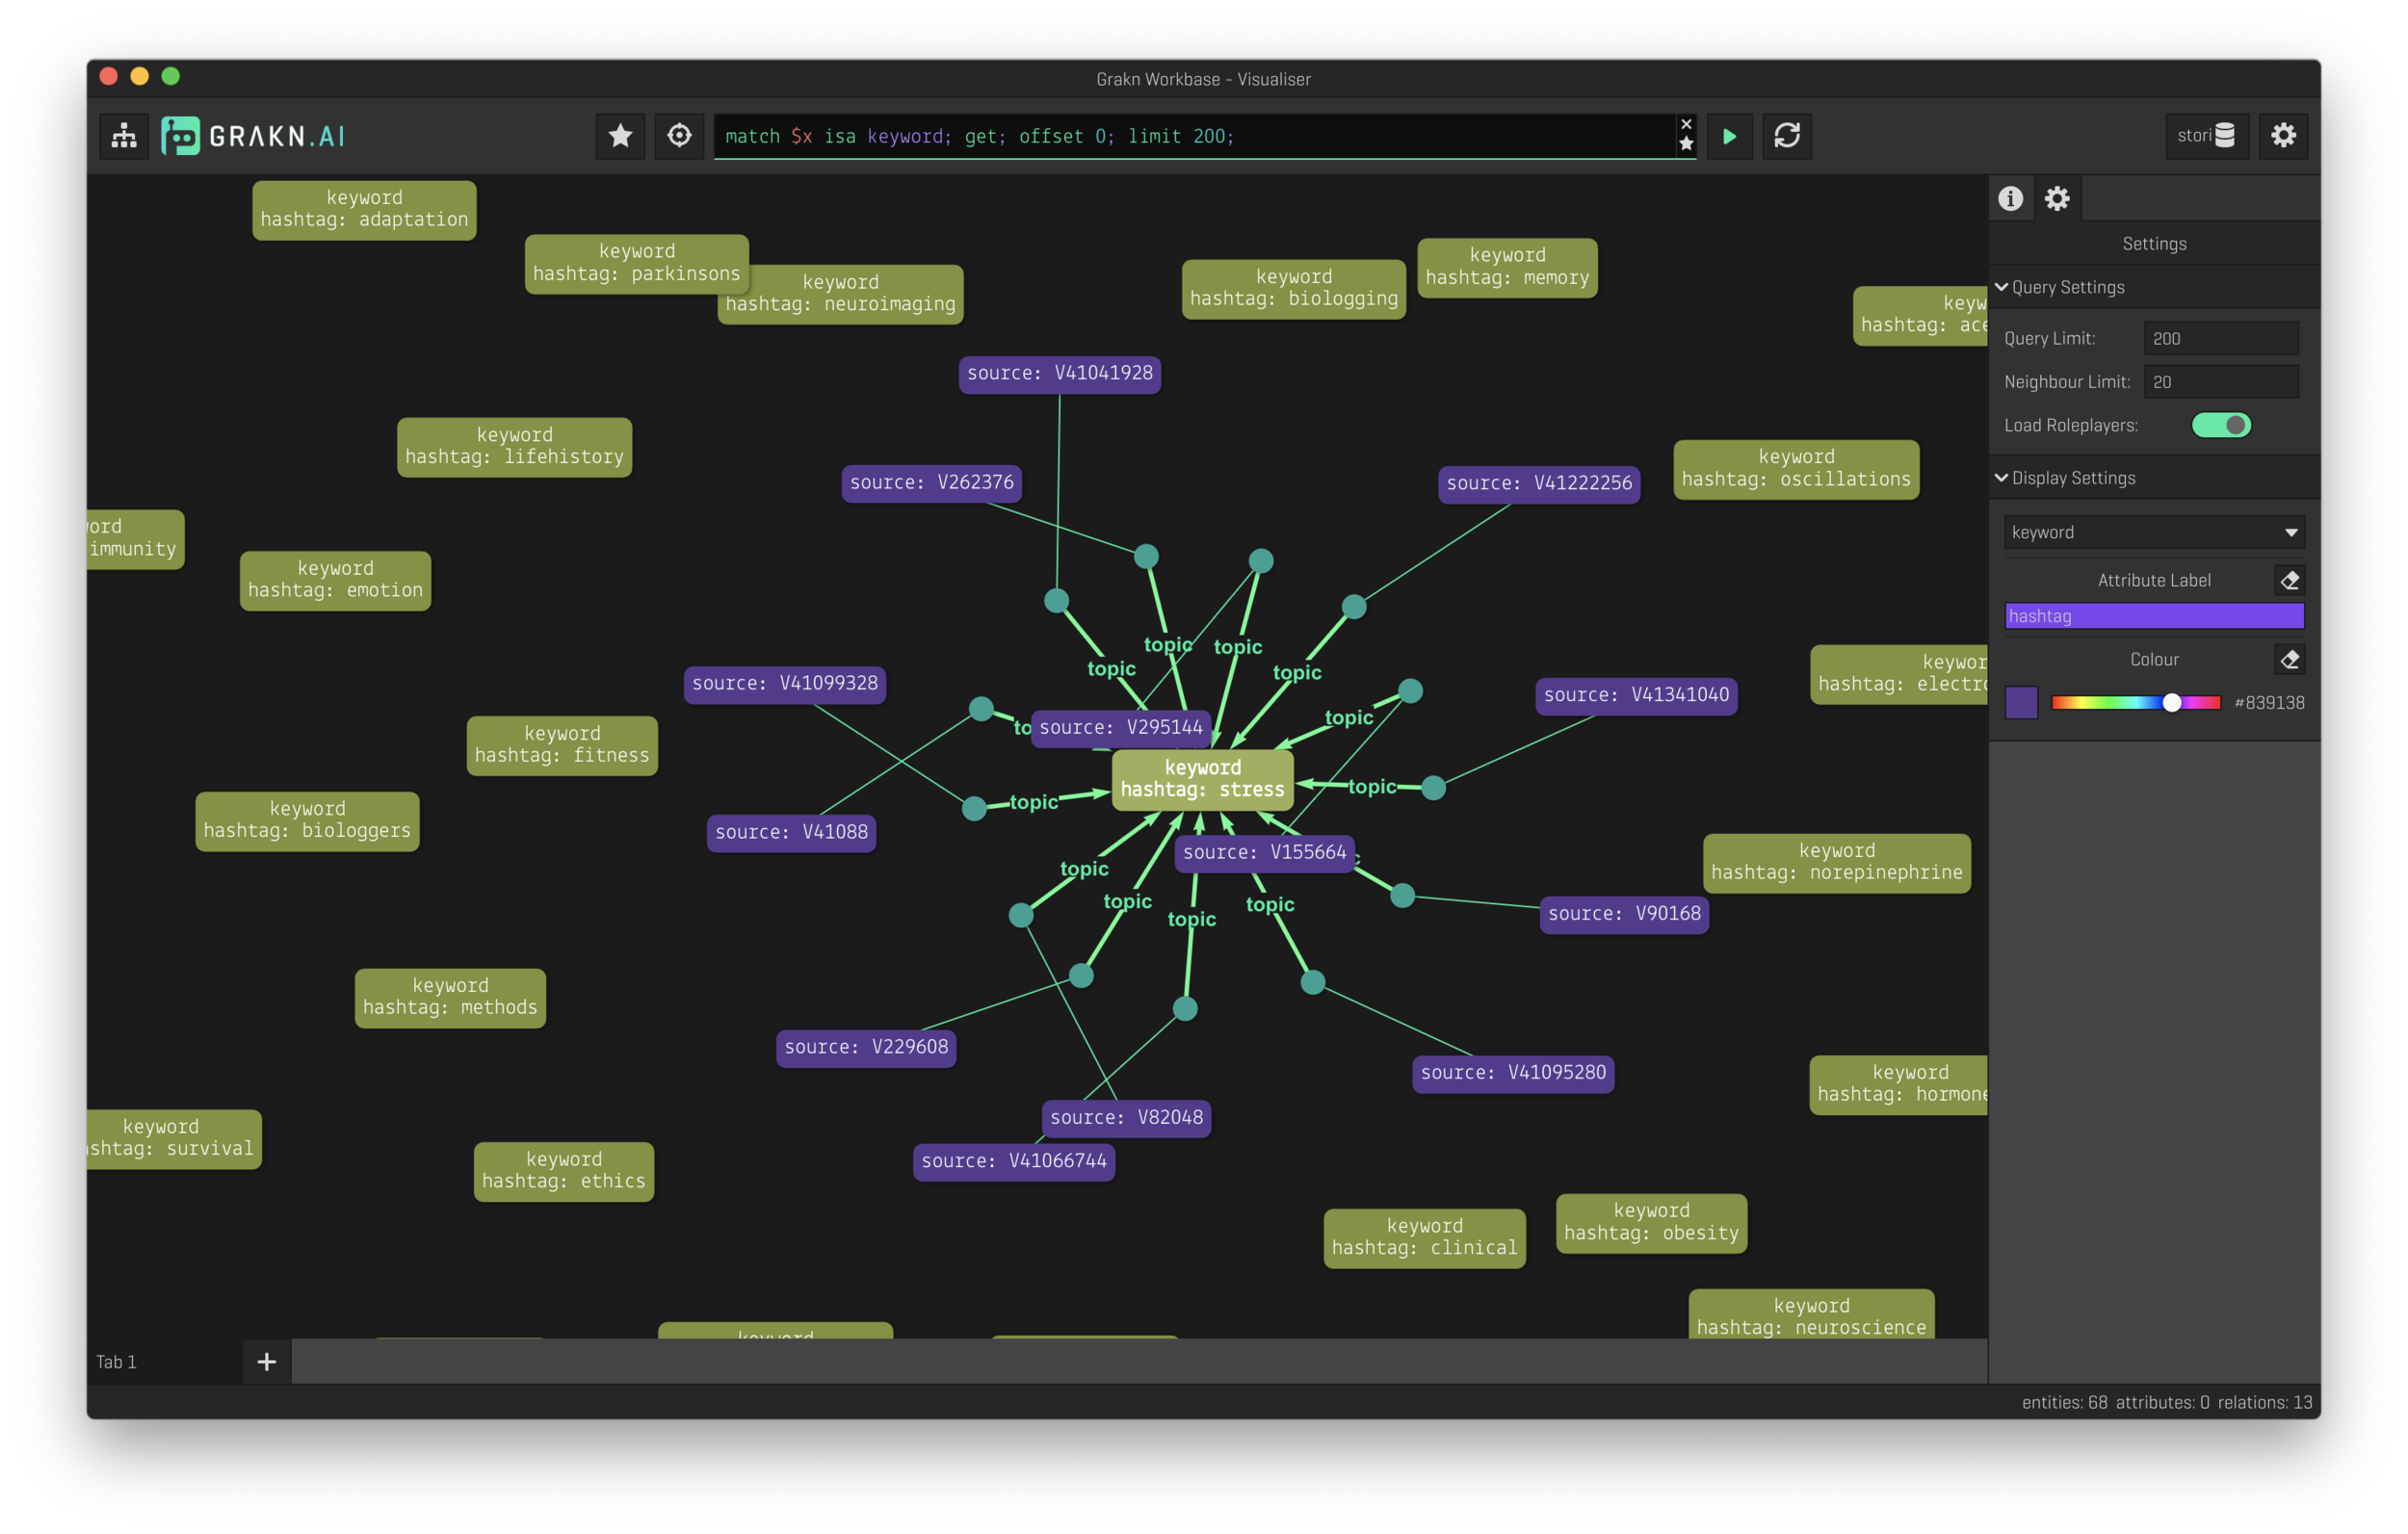
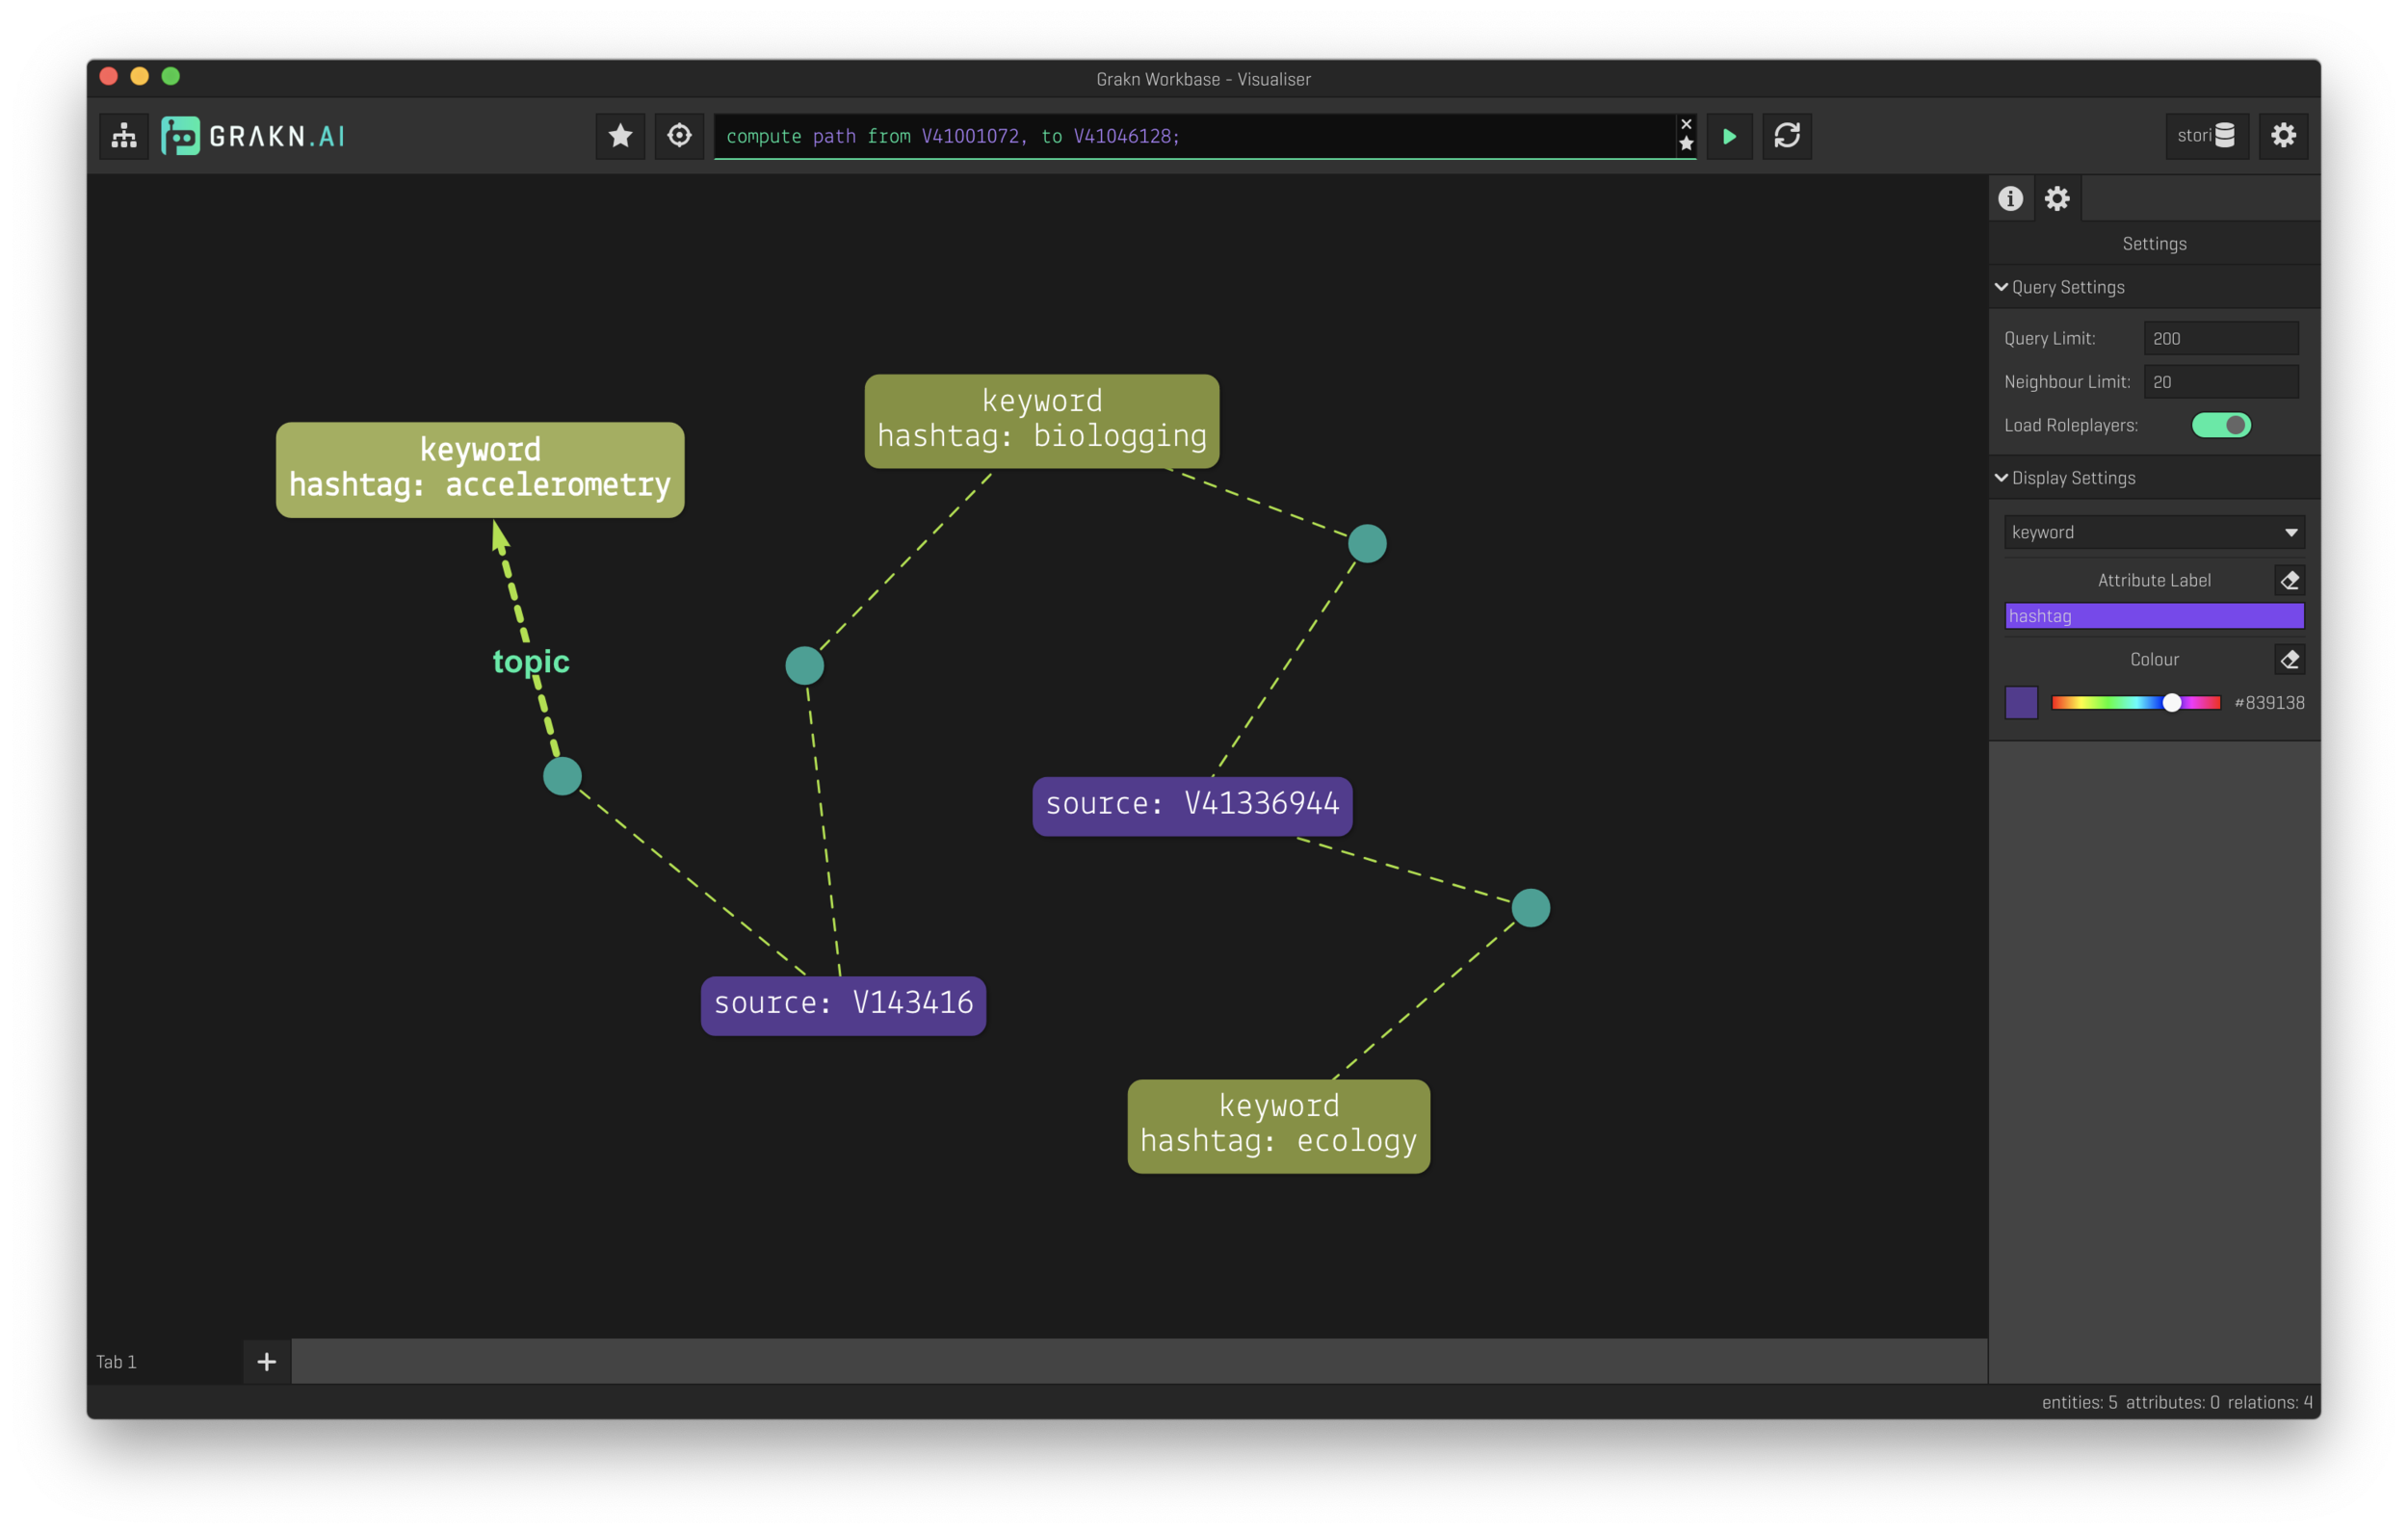
The true power of a knowledge base is the ability to explore data as a graph. This is where the Grakn button comes into play. Right now, Stori writes all the source tags (and associated sources) into the Grakn database and launches the Grakn Workbase explorer. Now data can be explored either by clicking tags of interest, viewing the entire knowledge base as a network of relations, or through their powerful query language.
Future of stori
As it stands, Stori is an alpha product and not yet public-facing. Ideally, the graph would be seamlessly integrated with sources, annotations, and thoughts. There are many interesting problems and directions that remain unresolved:

Zhang et al. (2013)
-
Are there better source management tools? Such as Polar or Highlight, and will academics be willing and able to use those alongside or in a rapid workflow with their citation manager (see Papers, Bookends, Zotero, Mendeley)? Do all-encompassing tools like DEVONthink have an advantage towards better summary and graph tools?
-
How are other data sources integrated? The world’s knowledge isn’t always helpful or curated, but may be useful to import into a personal knowledge base at times—how? Are there ways to use larger data sets, or citation graphs to weigh data, assess its quality, or identify primary sources?
-
How is a knowledge graph integrated into end-user tools? Have you ever been writing something you know but you don’t remember where you read it or who said it? A personal knowledge base might help, but so could a broader search on a domain knowledge graph. Have you ever wanted to segue between two topics (e.g., ecology and electrophysiology) but you’re lacking the proper references? Could a tool that identifies these topics in your writing and hint at possible research directions or papers help?
-
Can we identify novel hypotheses using a graph? Finding neighboring topics that lack connections could be a way of identifying novel knowledge haps while providing literature to support those hypotheses. This could be a rapid way to ideate and assess feasability.
-
What is the best tagging tool? The advantage of manual tags is that they create a highly curated data set. It essentially removes the need for a powerful thesaurus (see Leximancer for a dictionary-based workflow): if you call it a rhythm instead of oscillation, you can decide. However, this lacks there should be some “smart” tagging or suggestions and there should be some standards involved.
-
Could a graph enable real-time natural language queries? “Hey Stori, find me the primary literature for Gaidica et al. 2019”… resulting in a citation graph leading back to Albin et al. 1989. Can we ask a graph to identify similar topics? (e.g., “show me how stress and sleep relate”). Can a graph include sentiment? (e.g., “show me papers where dopamine replacement therapy had positive outcomes”).
Conclusion
Is this tool worth pursuing? The premise seems to resonate with everyone. I think it is especially useful for getting up to speed in a new domain, then generating your own summaries (or grant pitches) fast, and looking at how your new knowledge integrates with what you already know. I would really like your thoughts.

Jeffrey F
September 10, 2021 at 6:55 pm
Thanks forr writing