Does zero-padding a FFT matter?
Zero-padding a Fast Fourier Transform (FFT) can increase the resolution of the frequency domain results (see FFT Zero Padding). This is useful when you are looking to determine something like a dominant frequency over a narrow band with limited data.
Here, I examine the case of a slow-wave (<4 Hz) signal. I am detecting the dominant frequency as determined by the power spectrum, and then examining how the phase changes as the FFT is zero-padded by a factor of n, where n=1 is no zero-padding.
Methods & Results
I used 10,000 trials of slow-wave data that were recorded at 250 Hz (each trial was 1,024 samples). These data were subject to a slow-wave IIR elliptical filter. For each trial, I padded the data by a factor n; if n=2, the 1,024 zeros are added to the original signal. Below shows a single trial and how changing n ‘smooths’ the power spectrum (middle) leading to a more accurate assessment of phase (bottom).
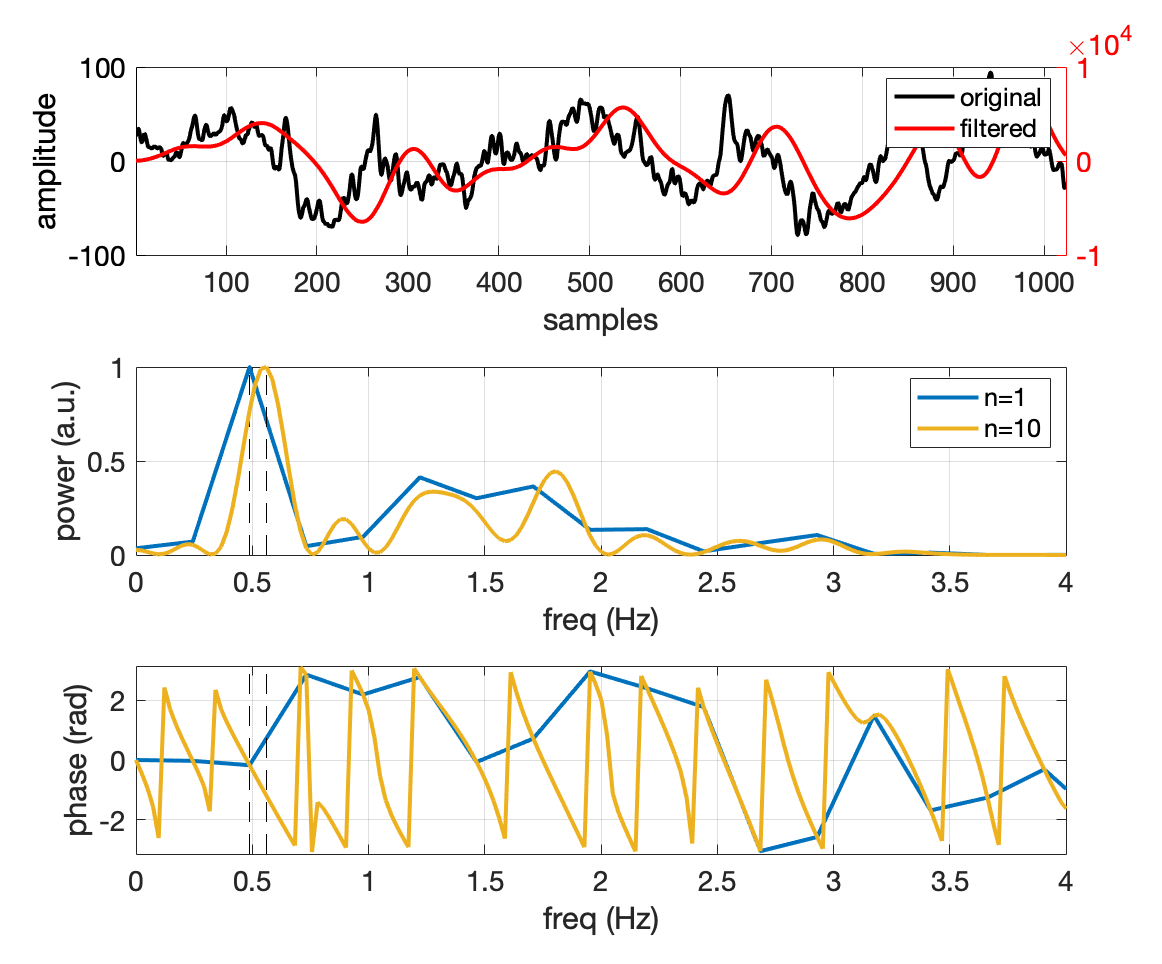
Single trial data. Top: original and filtered data, no padding (n=1). Middle: FFT power. Bottom: FFT phase.
The plot below shows how different each pad factor was to the last pad iteration, wrapped to pi. This assumes the last pad iteration (e.g., n=10) is the most accurate estimation of the actual phase of the signal at the dominant frequency.
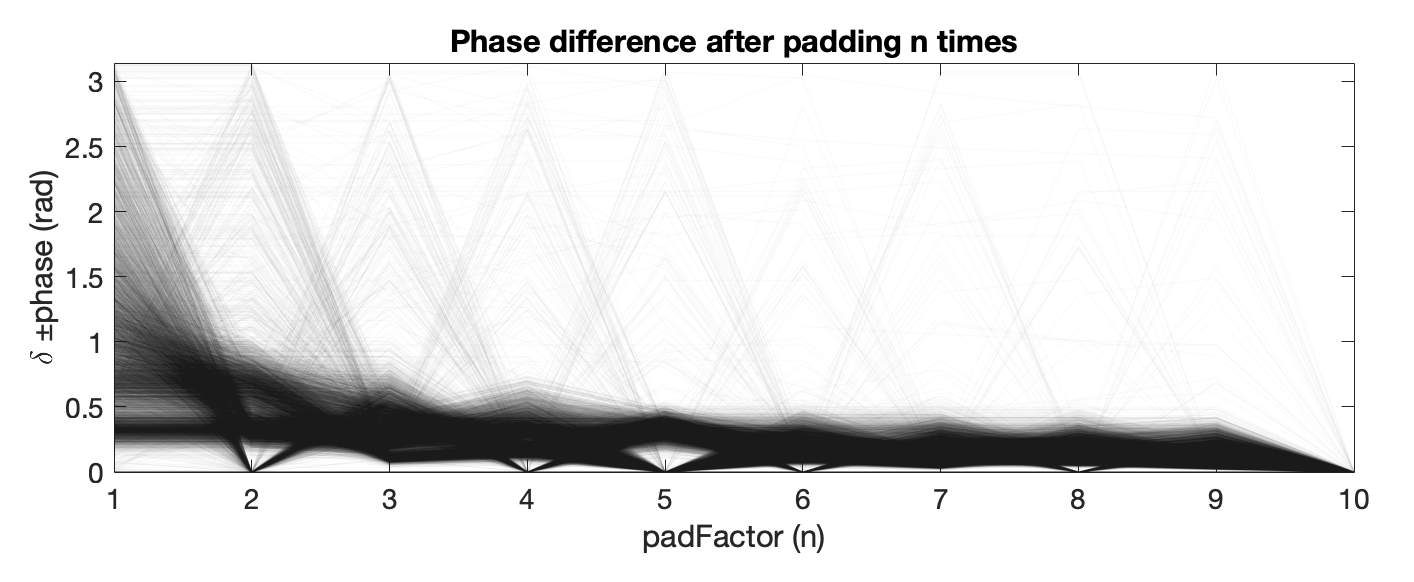
Phase difference after padding n times.
Interpretation & Use
The error in the phase of the FFT decreases as padding increases (i.e. converges), as expected, where n=10 is the trivial case and equals 0. The degree to which this matters in application-dependent—I don’t think a p-value really helps the interpretation, especially because these data are particular to the slow-wave use case. However, it is helpful to know how much of the data lies how far away.
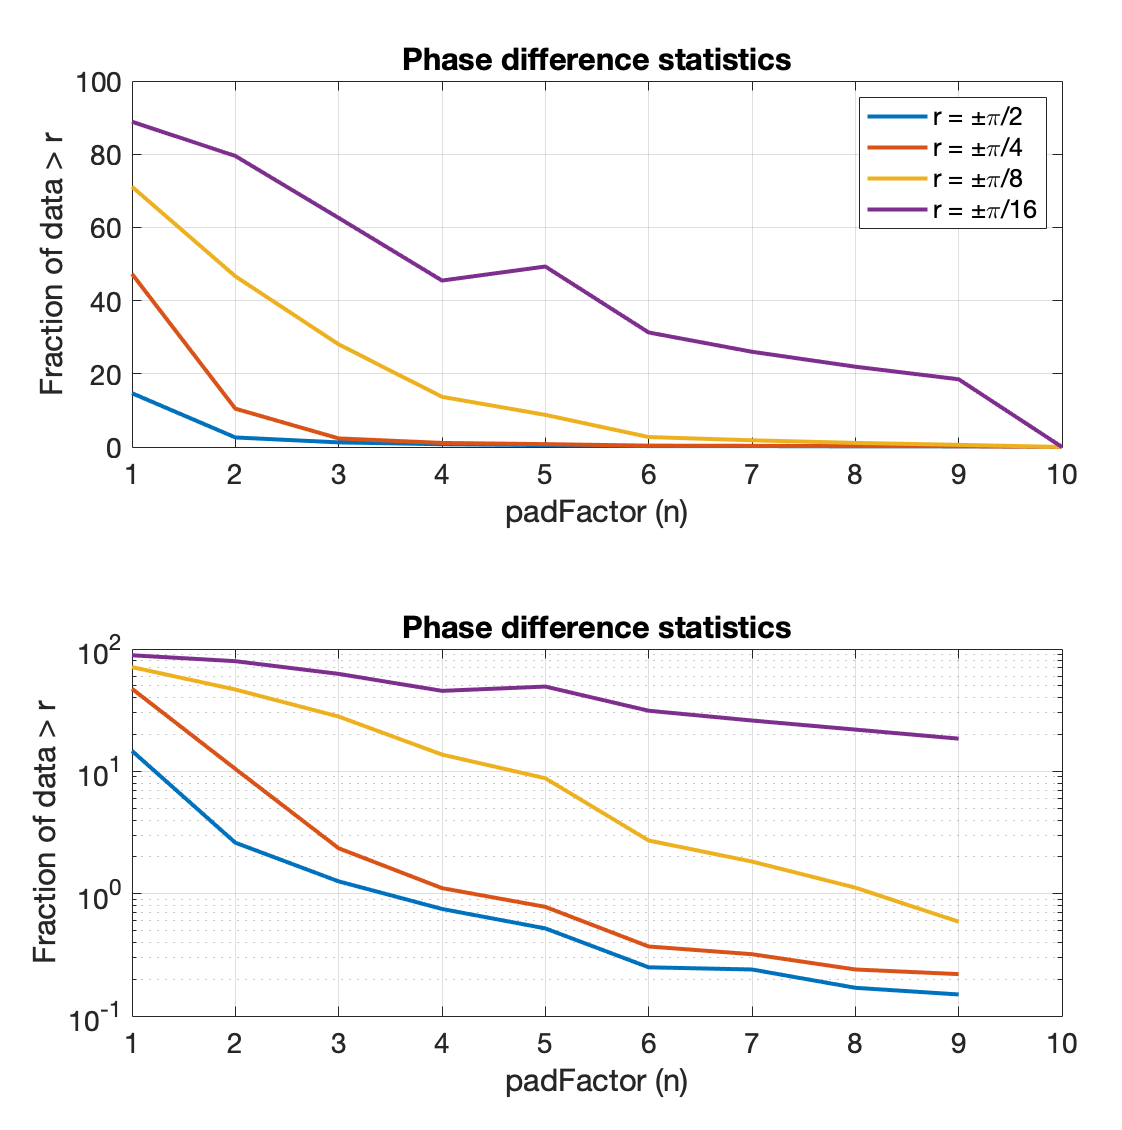
Phase error; note, n=10 is the trivial case and equals 0. Top: linear scale, Bottom: log scale.
This plot says that ~70% data have an ‘error’ greater than ±π/8 without any zero-padding (n=1) and decreases to ~50% for n=2. The practical question is really how much error is acceptable to your system. As put in MATLAB – FFT and Zero Padding, if you have the choice between zero-padding and including more data, always chose more data.
