Characterizing Tremor from Video using Frequency Analysis in MATLAB
Previously I shared a function useful for Creating an Actogram from Video in MATLAB. However, in cases where movement is rhythmic, like in cases of Parkinson’s disease and essential tremor, understanding movement in the frequency domain is helpful. Using similar video analysis principles (assessing the change in pixel values from frame-to-frame) extracting frequency information is rather straight forward.
[allFrames,pos] = videoFreqAnalysis(videoFile,resizeFactor,ROItimestamp,freqList);
This method allows you to analyze a video for the frequencies provided in freqList given that the maximum frequency is less than the video frame rate divided by two (Shannon’s sampling theorem).
Find these functions on Github: MoveAlgorithms
Example
Exporting your original video to a smaller size will speed processing. This sample video of my hand is 15 seconds, taken with an iPhone, then exported as 540p with no audio.
The video processing follows these simple steps:
- Prompt the user to select a region of interest (ROI). The resulting ROI is used for analysis; anything outside of the selected ROI is not used. This helps focus the analysis and also speeds the analysis.
- Process all video frames. Every frame is converted to black and white, slightly contrasted, and then put into the matrix allFrames.
- Threshold the data so only pixels that show large movement (in the 80th percentile) are analyzed.
- Convert time domain data in the frequency domain using a complex scalogram (tip: we also use this with low-pass filtered electrophysiology data).
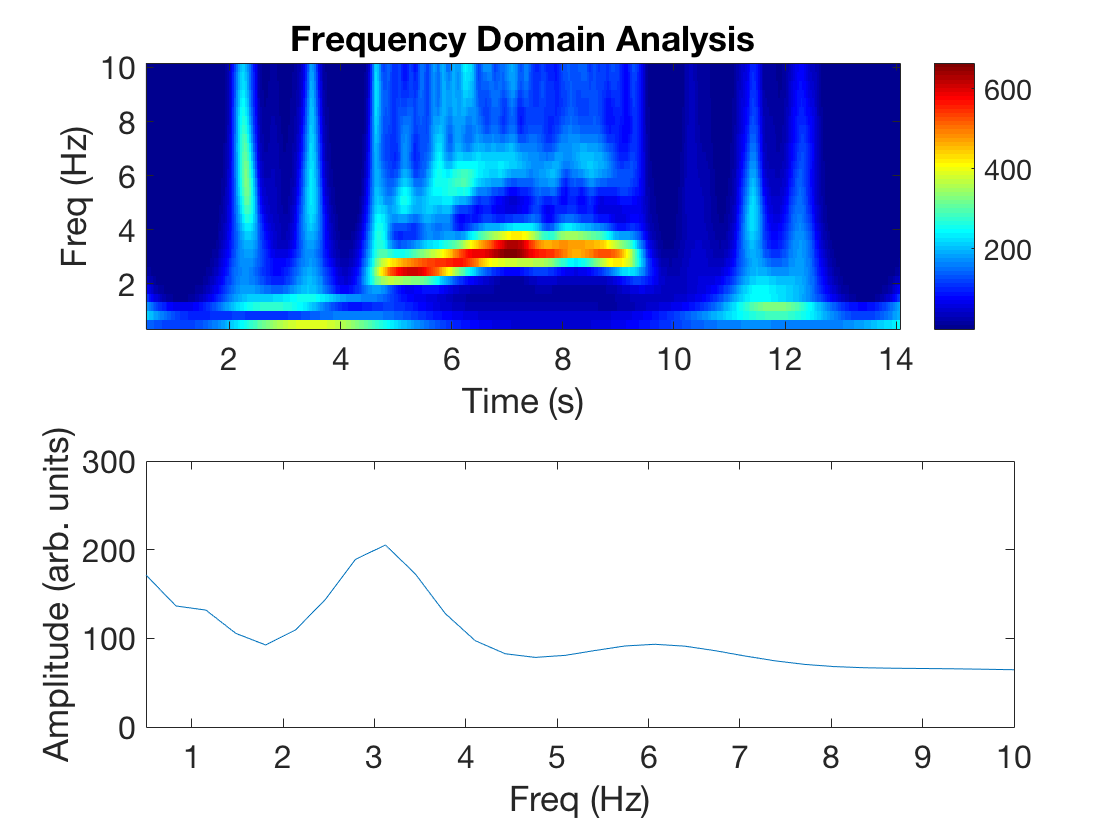
Top: Based on the fpass and resulting freqList, a scalogram heatmap is presented that shows the power of each frequency band over the duration of the video.
Bottom: This plot removes all temporal information and represents the mean frequency transform of the scalogram, useful for finding peaks in the frequency content of the video.
Together, the tremor from the video is present from the 5-10 second mark and peaks in the ~3 Hz band. The one major pitfall of this method is the lack of a standard amplitude measure. Depending on the video resolution and lighting conditions the amplitude will change. Controlling for these variables would make for a more meaningful comparisons between videos or subjects.
Frame-by-frame Heatmap
One visualization of the frequency domain is to take the pixels from the ROI and analyze them over a ±1 second window, where the red colors represent greater amplitude of the fpass band. The ROI is very large in the video below, but shows where movement is identified using this method.
