Making your own colormap (cmap) in MATLAB
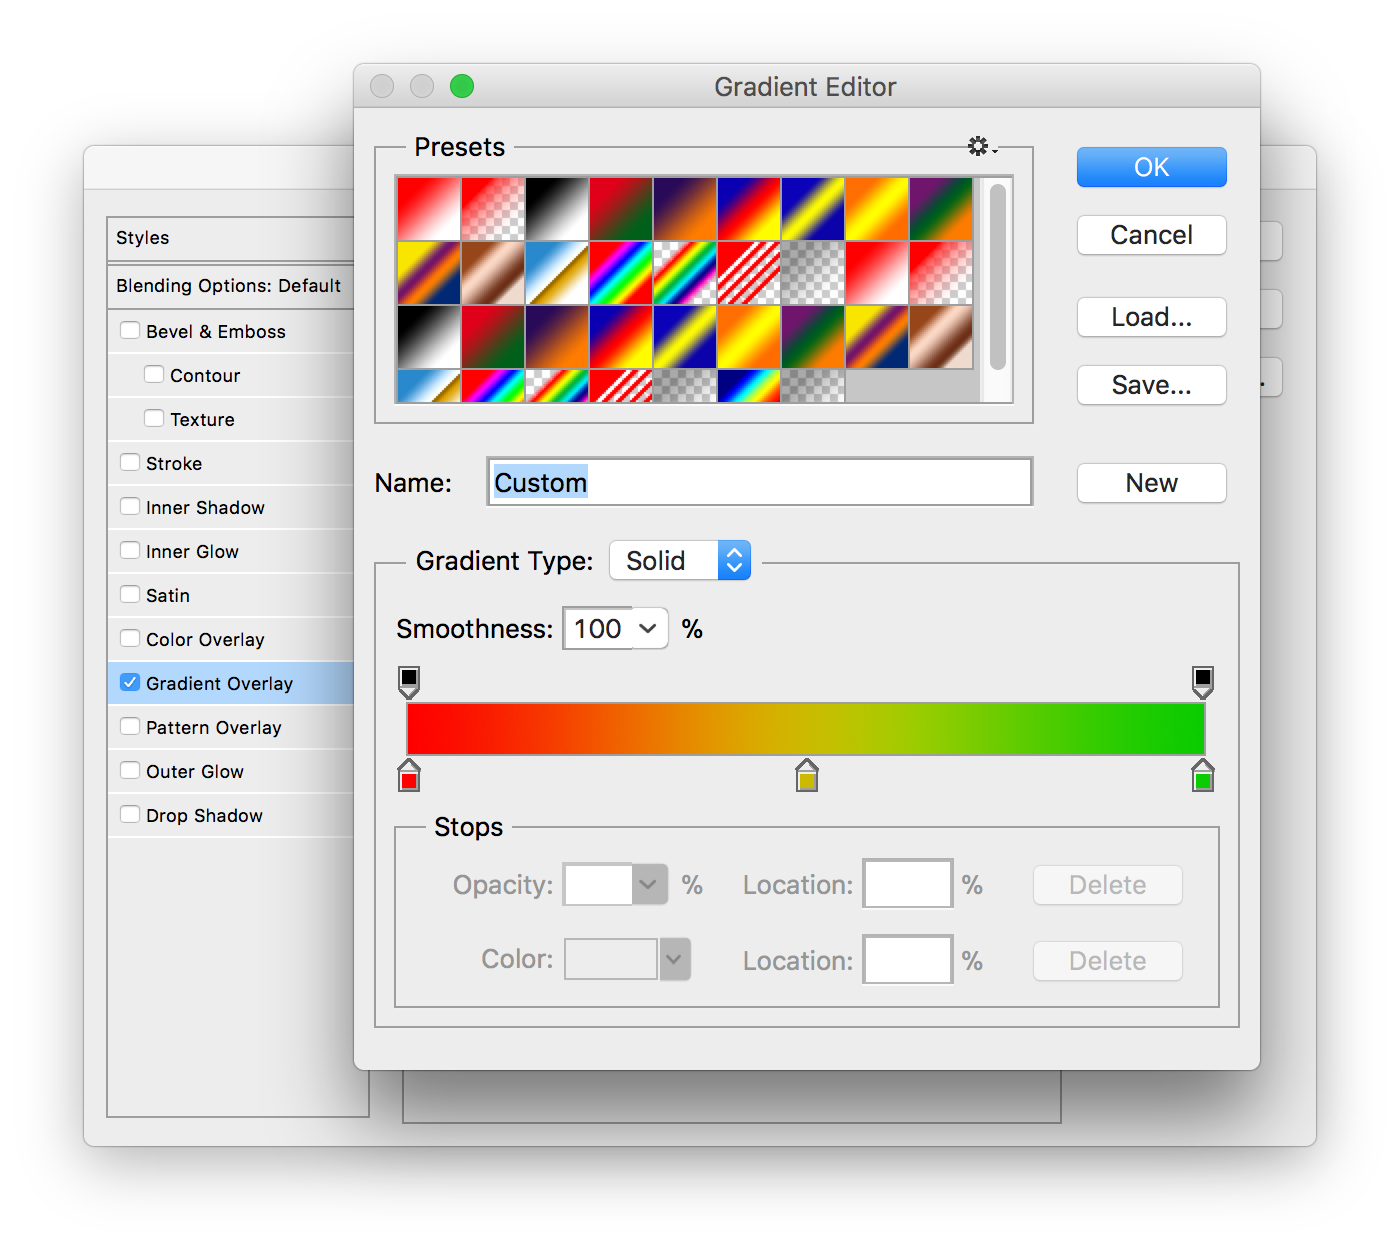
This function will use the first row of an image and allow you to use that as a colormap, or as individual colors for your own application. It just extracts colors and puts them into an array. For instance, I designed this “traffic light” color scheme and want to apply it to a plot where each color represents some reaction time.

You can use any image, but here is how to design the gradient in Adobe Photoshop:
-
Open a new document with a width greater or equal to the amount of elements you will be coloring in MATLAB (for instance, width: 1500 pixels, height: 200 pixels). The height is only so you can visualize the color scheme; the function will only require a single row.
-
Use the Shape tool to draw a rectangle the size of the canvas.
-
Double click the rectangle layer and apply a Gradient Overlay. Use the color tools to make your gradient.
-
Save your document as a Photoshop file first if you want to archive the original, but then export it to a JPG of the original size either using Save As, or Save for Web.

The mycmap function has one mandatory input: the image filename. There is one optional input: the number of elements to be returned. For instance, if you are using the colors to set cmap, you probably don’t need to set the number of elements (it will just return a colors array the width of your image). On the other hand, if you are using the colors to set the color of say, 55 different lines on a plot, you will pass that number as the second input to the function, and the returned array colors will have 55 rows.
Example
Below are phase plots from an electrophysiology experiment where each line represents a single trial. Each line has been colored based on reaction time (low-to-high) using the colors from the mycmap function.

Recent Comments
Archives
- April 2023
- January 2023
- November 2022
- May 2022
- March 2022
- January 2022
- December 2021
- April 2021
- December 2020
- October 2020
- August 2020
- July 2020
- March 2020
- February 2020
- January 2020
- December 2019
- November 2019
- October 2019
- January 2019
- December 2018
- November 2018
- August 2018
- July 2018
- April 2018
- March 2018
- November 2017
- October 2017
- February 2017
- October 2016
- August 2016
- July 2016
- November 2015
- October 2013
- February 2013
- January 2013
- August 2012
- July 2012
- June 2012
- May 2012
- April 2012
- February 2012
- December 2011
